


Probably many of you knows that for creating control dashboards for some Dynamics 365 Business Central SaaS tenants of for ISV apps I use Azure Managed Grafana, a managed service that enables you to run Grafana natively within the Azure cloud platform. I’ve blogged in the past here and here and I’ve also shared a free dashboard template.
For supporting enterprise-level security also for telemetry data, Azure Managed Grafana has now a new feature (currently in preview) that permits you to connect to your instance using a Managed Private Endpoint. Azure Managed Grafana’s managed private endpoints are endpoints created in a Managed Virtual Network that the Managed Grafana service uses. They establish private links from that network to your Azure data sources. Azure Managed Grafana sets up and manages these private endpoints on your behalf. You can create managed private endpoints from your Azure Managed Grafana to access other Azure managed services (for example, Azure Monitor private link scope or Azure Monitor workspace).
When you use managed private endpoints, traffic between your Azure Managed Grafana and its data sources traverses exclusively over the Microsoft backbone network without going through the internet. Managed private endpoints protect against data exfiltration. A managed private endpoint uses a private IP address from your Managed Virtual Network to effectively bring your Azure Managed Grafana workspace into that network.
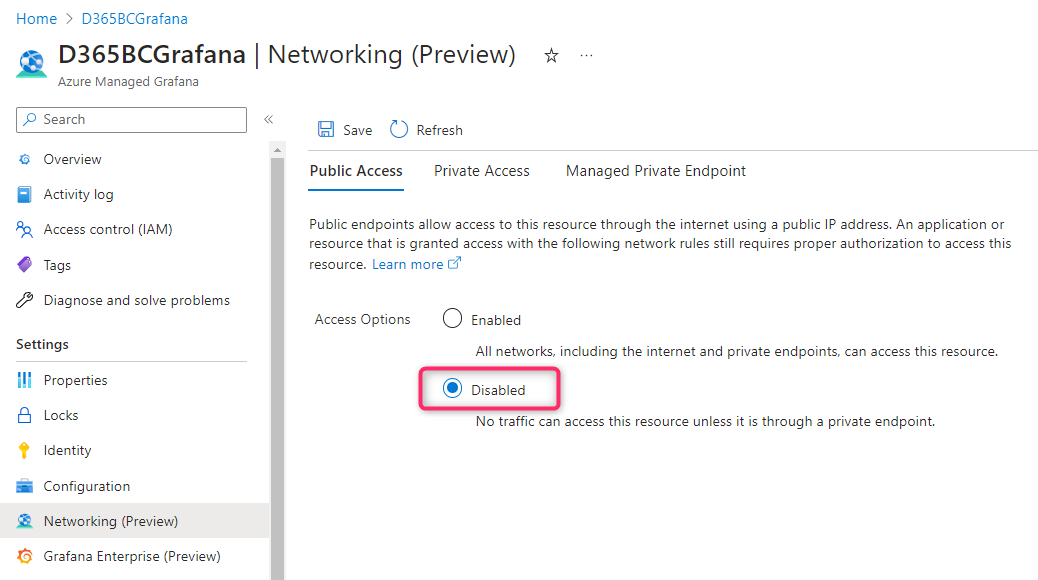
When you create an Azure Managed Grafana instance, public access is enabled by default (you can then create users and assign roles). If you want to use private endpoints and disable public access, you first need to open your Azure Managed Grafana instance and under Settings, select Networking (Preview). Here under the Public Access tab you can disable public access to the instance:
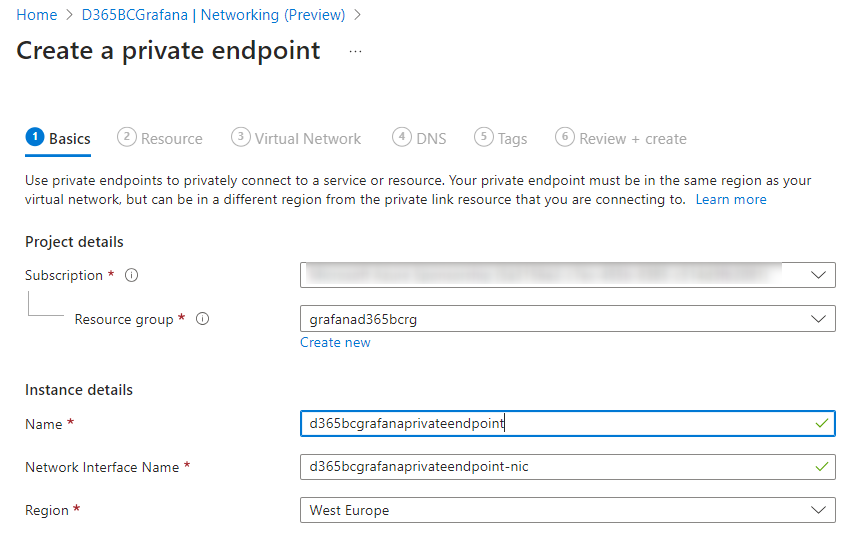
To create a managed private endpoint for your Managed Grafana workspace connected to Dynamics 365 Business Central telemetry data, via the Azure portal navigate to your Grafana workspace and then select Networking (Preview). Here select the Private Access tab and then Add to start setting up a new private endpoint:
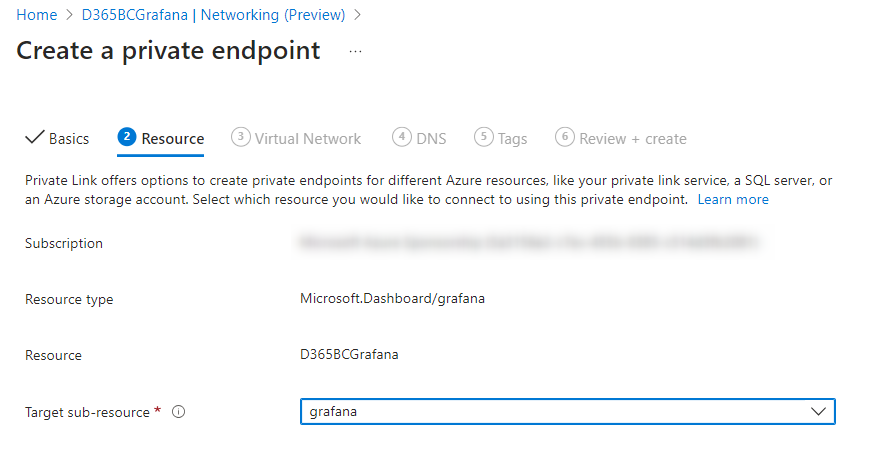
In the Resource tab, you can specify the target Azure resource. The resource type Microsoft.Dashboard/grafana and the target sub-resource grafana indicate that you’re creating an endpoint for an Azure Managed Grafana workspace:
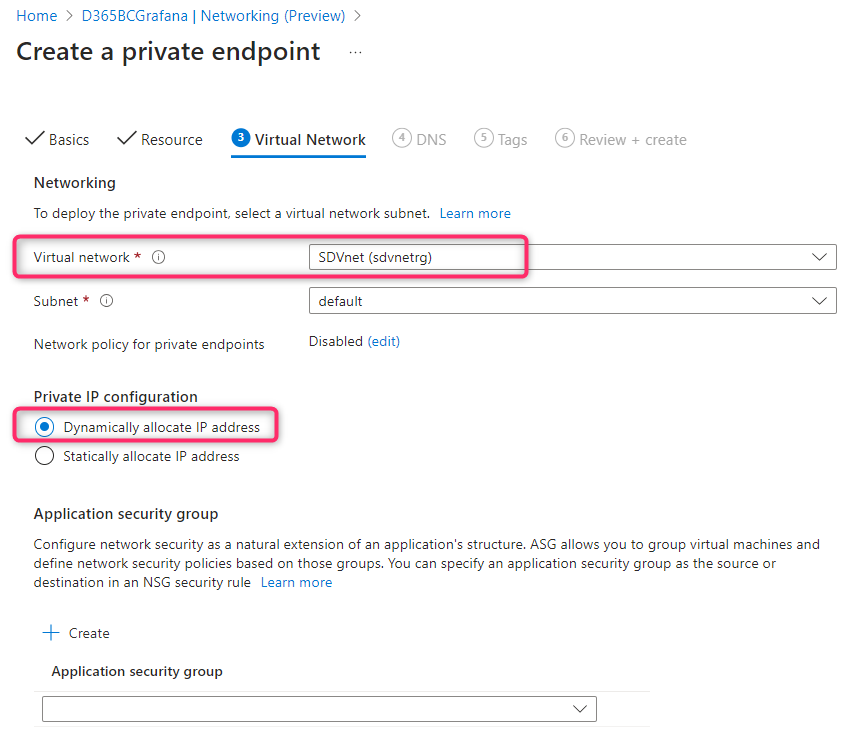
In the Virtual Network tab you can select or create a Virtual network to deploy the private endpoint to:
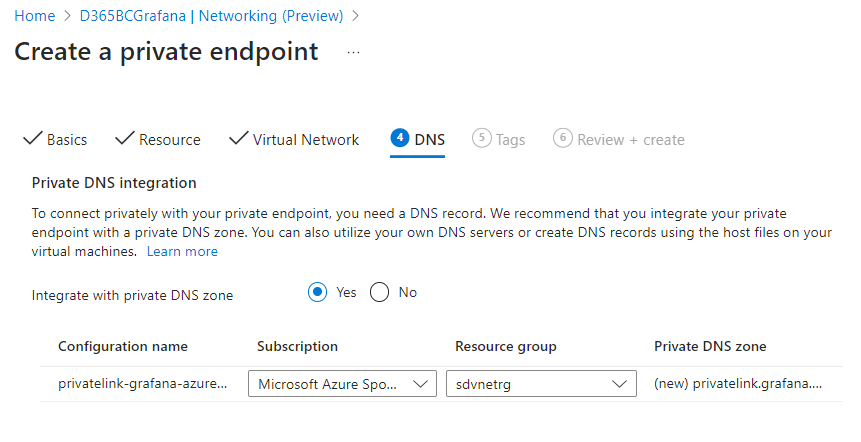
In the DNS tab you can configure a DNS record. If you don’t want to make changes to the default settings, you can move forward to the next tab:
Then you can go to the Review + create tab to review all the settings about your Azure Managed Grafana workspace, private endpoint, virtual network and DNS. You can also select Download a template for automation to reuse JSON data from this form later.
Once deployment is complete, you’ll get a notification that your endpoint has been created. If it’s auto-approved, you can start accessing your workspace privately. Otherwise, you will have to wait for approval.
In this way you have set up private access from your users to a Managed Grafana workspace:

If you have strong security requirements for your Business Central telemetry data and you want to create advanced portals for your users, I suggest to give it a check…
