PREFACE: Microsoft has created two wonderful Power BI apps for analyzing Dynamics 365 Business Central telemetry:
- Dynamics 365 Business Central Usage Analytics: Power BI app that permits you to visualize different aspects of a Dynamics 365 Business Central tenant usage. Available at https://aka.ms/bctelemetryreport
- Dynamics 365 Business Central App Usage: Power BI app that permits you to visualize different aspects of a Dynamics 365 Business Central app usage (for ISVs). Available at https://aka.ms/bctelemetry-isv-app
and these (together with the Azure Portal) are the default ways to analyze telemetry in a Dynamics 365 Busines Central tenant.
Saying that, in my telemetry session at Directions EMEA 2022 I showed different “alternative” ways to use Dynamics 365 Business Central telemetry and how you can do more with telemetry data or how you can enhance the telemetry experience for every user in your company.
One of the demos I provided in Hamburg was related to data visualizations via dashboards and I showed the usage of Azure Managed Grafana service in order to create interactive dashboards with great visual impacts. I talked about using this new service for Business Central telemetry also in the past here.
Azure Managed Grafana is a rich and extensible visualization application built on the Grafana Pro software. As a fully managed Azure service, you can effortlessly deploy Grafana as part of your observability solution and create unified dashboards to monitor data from Azure Monitor, Azure Data Explorer and other data stores.
Why Grafana? Interesting aspects are:
- Impacting visual outputs and rich dashboarding features
- Possibility to add multiple data sources to a dashboard
- Role-based dashboards (you can create roles and assign users to a dashboard)
- Possibility to access the dashboards via a dedicated instance (no need to access the Azure Portal)
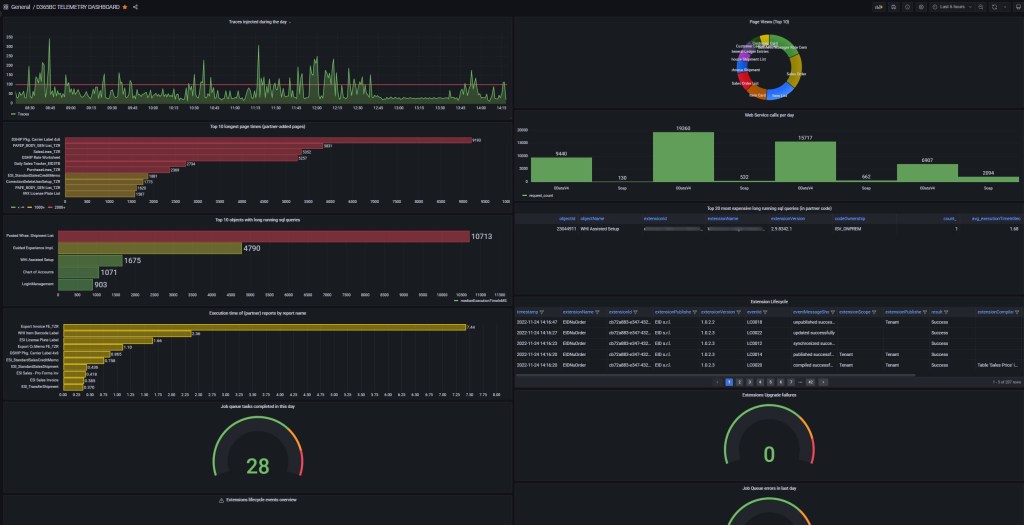
My presented Grafana dashboard was connected to a LIVE Dynamics 365 Business Central customer and it’s what I use in real world for providing a “visual” access to their IT department and to our consultants (that are not Power BI users).
The dashboard I showed is the following:
After my session at Directions EMEA and after the Telemetry workshop I’ve hosted this week in Microsoft Italy, someone of you asked for the possibility to have the same dashboard I’ve presented in that events.
At the following link you can download my Grafana dashboard template (JSON format).
To use the template, open it with a text editor and change the following parameters:
- YOURSUBSCRIPTIONID: substitute it with the GUID of your subscription
- YOURRESOURCEGROUP: substitute it with the Application Insights Resource Group
- YOURAPPLICATIONINSIGHTSINSTANCENAME: substitute it with the Application Insights instance name
- YOURDATASOURCEUID: your datasource UID (as per initializtion of the dashboard in the portal)
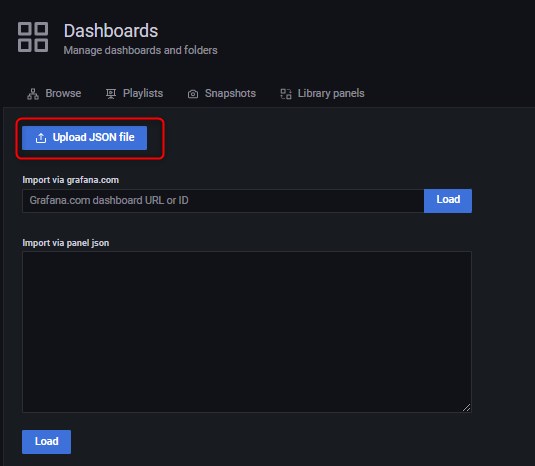
To import the dashboard, in your Azure Managed Grafana instance click Import under the Dashboards icon in the left side menu:
From here you can upload a dashboard JSON file, paste a Grafana.com dashboard URL or paste dashboard JSON text directly into the text area. Upload the previously created template and enjoy (and extend) it.


To make the import work you also have to change the datasource’s uid from “YdztdMvVk”, in my case to “azure-monitor-oob”.
LikeLiked by 1 person