

Have you ever heard about Grafana? Grafana is an open and composable observability and data visualization platform that permits you to visualize metrics, logs, and traces from multiple sources.
Grafana allows you to query, visualize, alert on and understand your metrics no matter where they are stored. You can create, explore, and share dashboards with your team, you can create dynamic dashboards, you can Vvisually define alert rules for your most important metrics and you can mix different data sources in the same graph (you can specify a data source on a per-query basis).
Starting from today, Grafana is also available as Azure Managed Grafana, a managed service that enables you to run Grafana natively within the Azure cloud platform. Azure Managed Grafana offers several new out-of-the-box dashboards for Azure Monitor but you can also use this new service to enhance your telemetry views with Azure Application Insights.
How to use Azure Managed Grafana?
To start using Azure Managed Grafana, sign in to the Azure Portal and search for Azure Managed Grafana. Then, create a new Grafana Workspace:
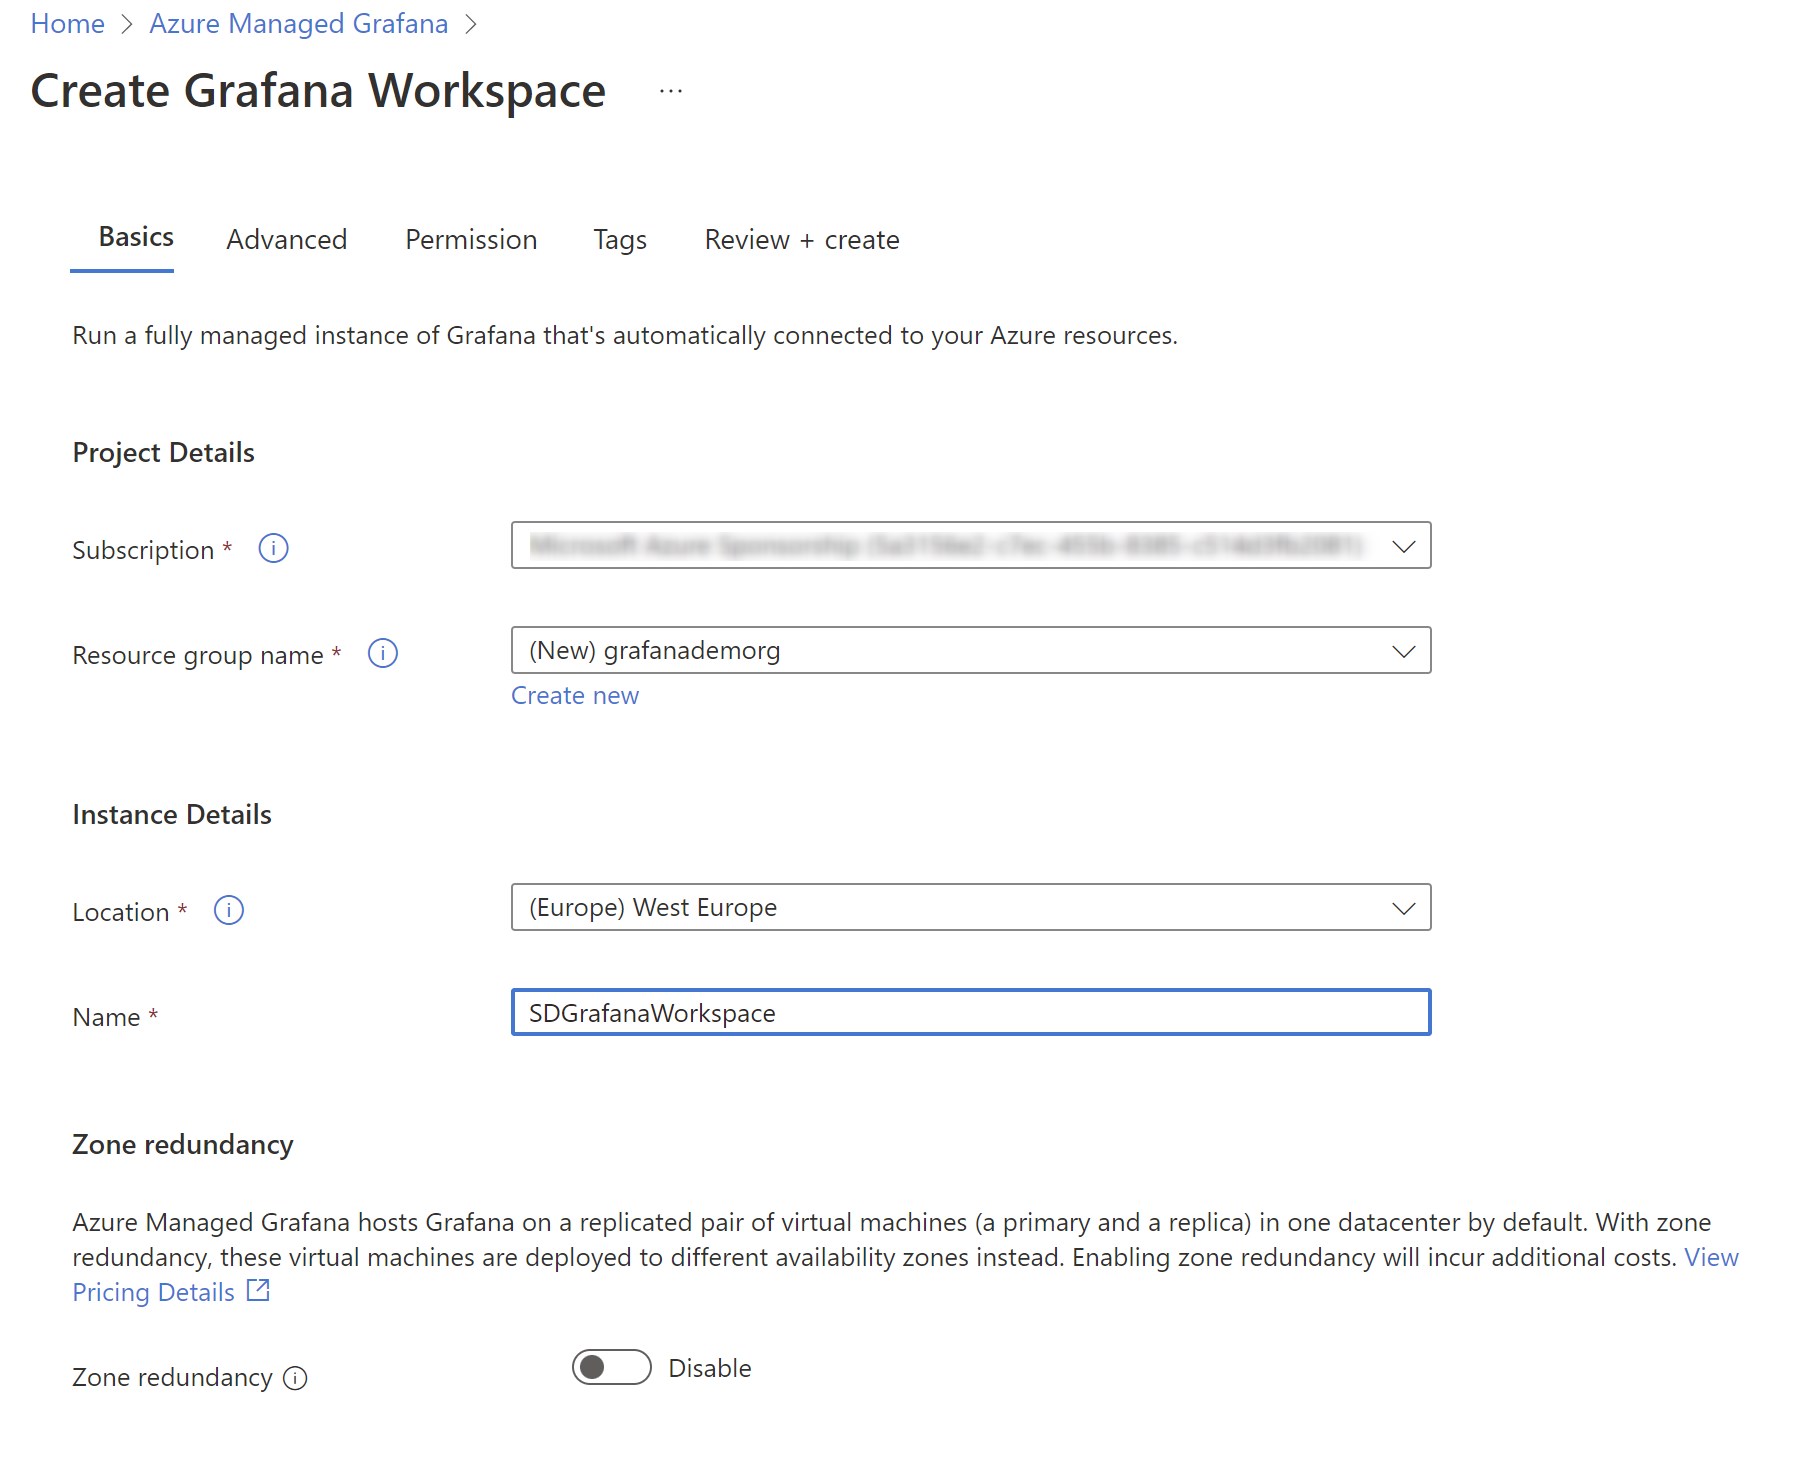
In the Basics tab you can sepcify the location and the name of your Azure Managed Grafana instance. You can also select if zone redundancy must be activated (zone redundancy is disabled by default. It automatically provisions and manages a standby replica of the Managed Grafana instance in a different availability zone within one region).
In the Advanced tab you can enable Grafana API access and you can enale a static IP if really needed. In the Permission tab you can specify who can access your Grafana instance:
Leave System assigned managed identity set to ON (default) and add the users that can access your Grafana instance (included yourself) as administrators:

Please remember that at the time of writing this post Azure Managed Grafana doesn’t support connecting with personal Microsoft accounts, so use corporate accounts instead.
When the resource is provisioned, you have a new Grafana workspace created and here you can see the Endpoint field:
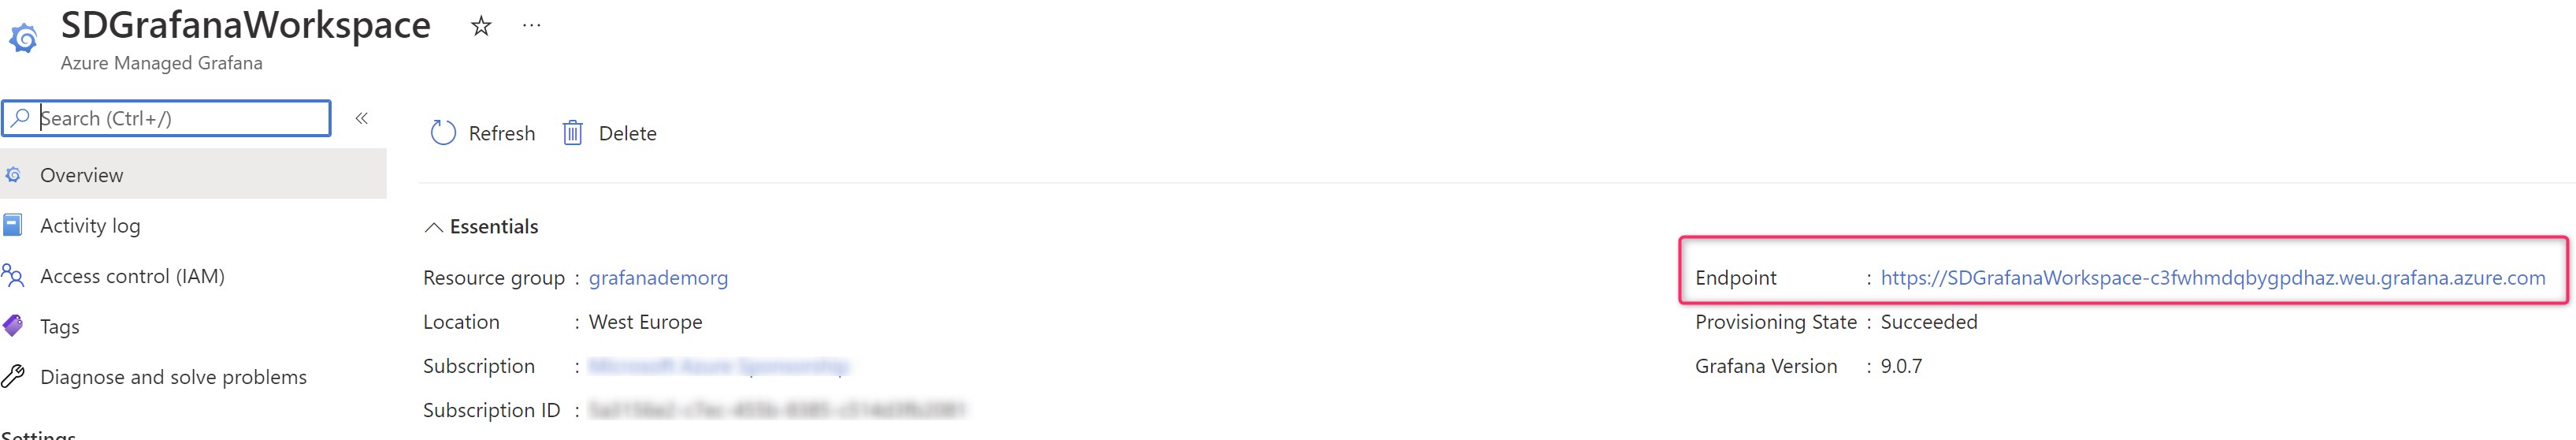
This is your Azure Grafana instance url. You can click on this url to access Grafana. Please remember that single sign-on via Azure Active Directory has been configured for you automatically so, if prompted, enter your Azure account.
When you open the endpoint, you have a default main page like the following:

Here you can start interacting with the Grafana application to configure data sources, create dashboards, reports and alerts.
Azure Managed Grafana includes by default an Azure Monitor datasource plugin and by default, the plugin is pre-configured with a Managed Identity that can query and visualize monitoring data from all resources in the subscription in which the Grafana workspace was deployed.
In this post, I want to show how to use Azure Managed Grafana to interact with an Azure Monitor instance (and the Application Insights service) connected to a Dynamics 365 Business Central tenant.
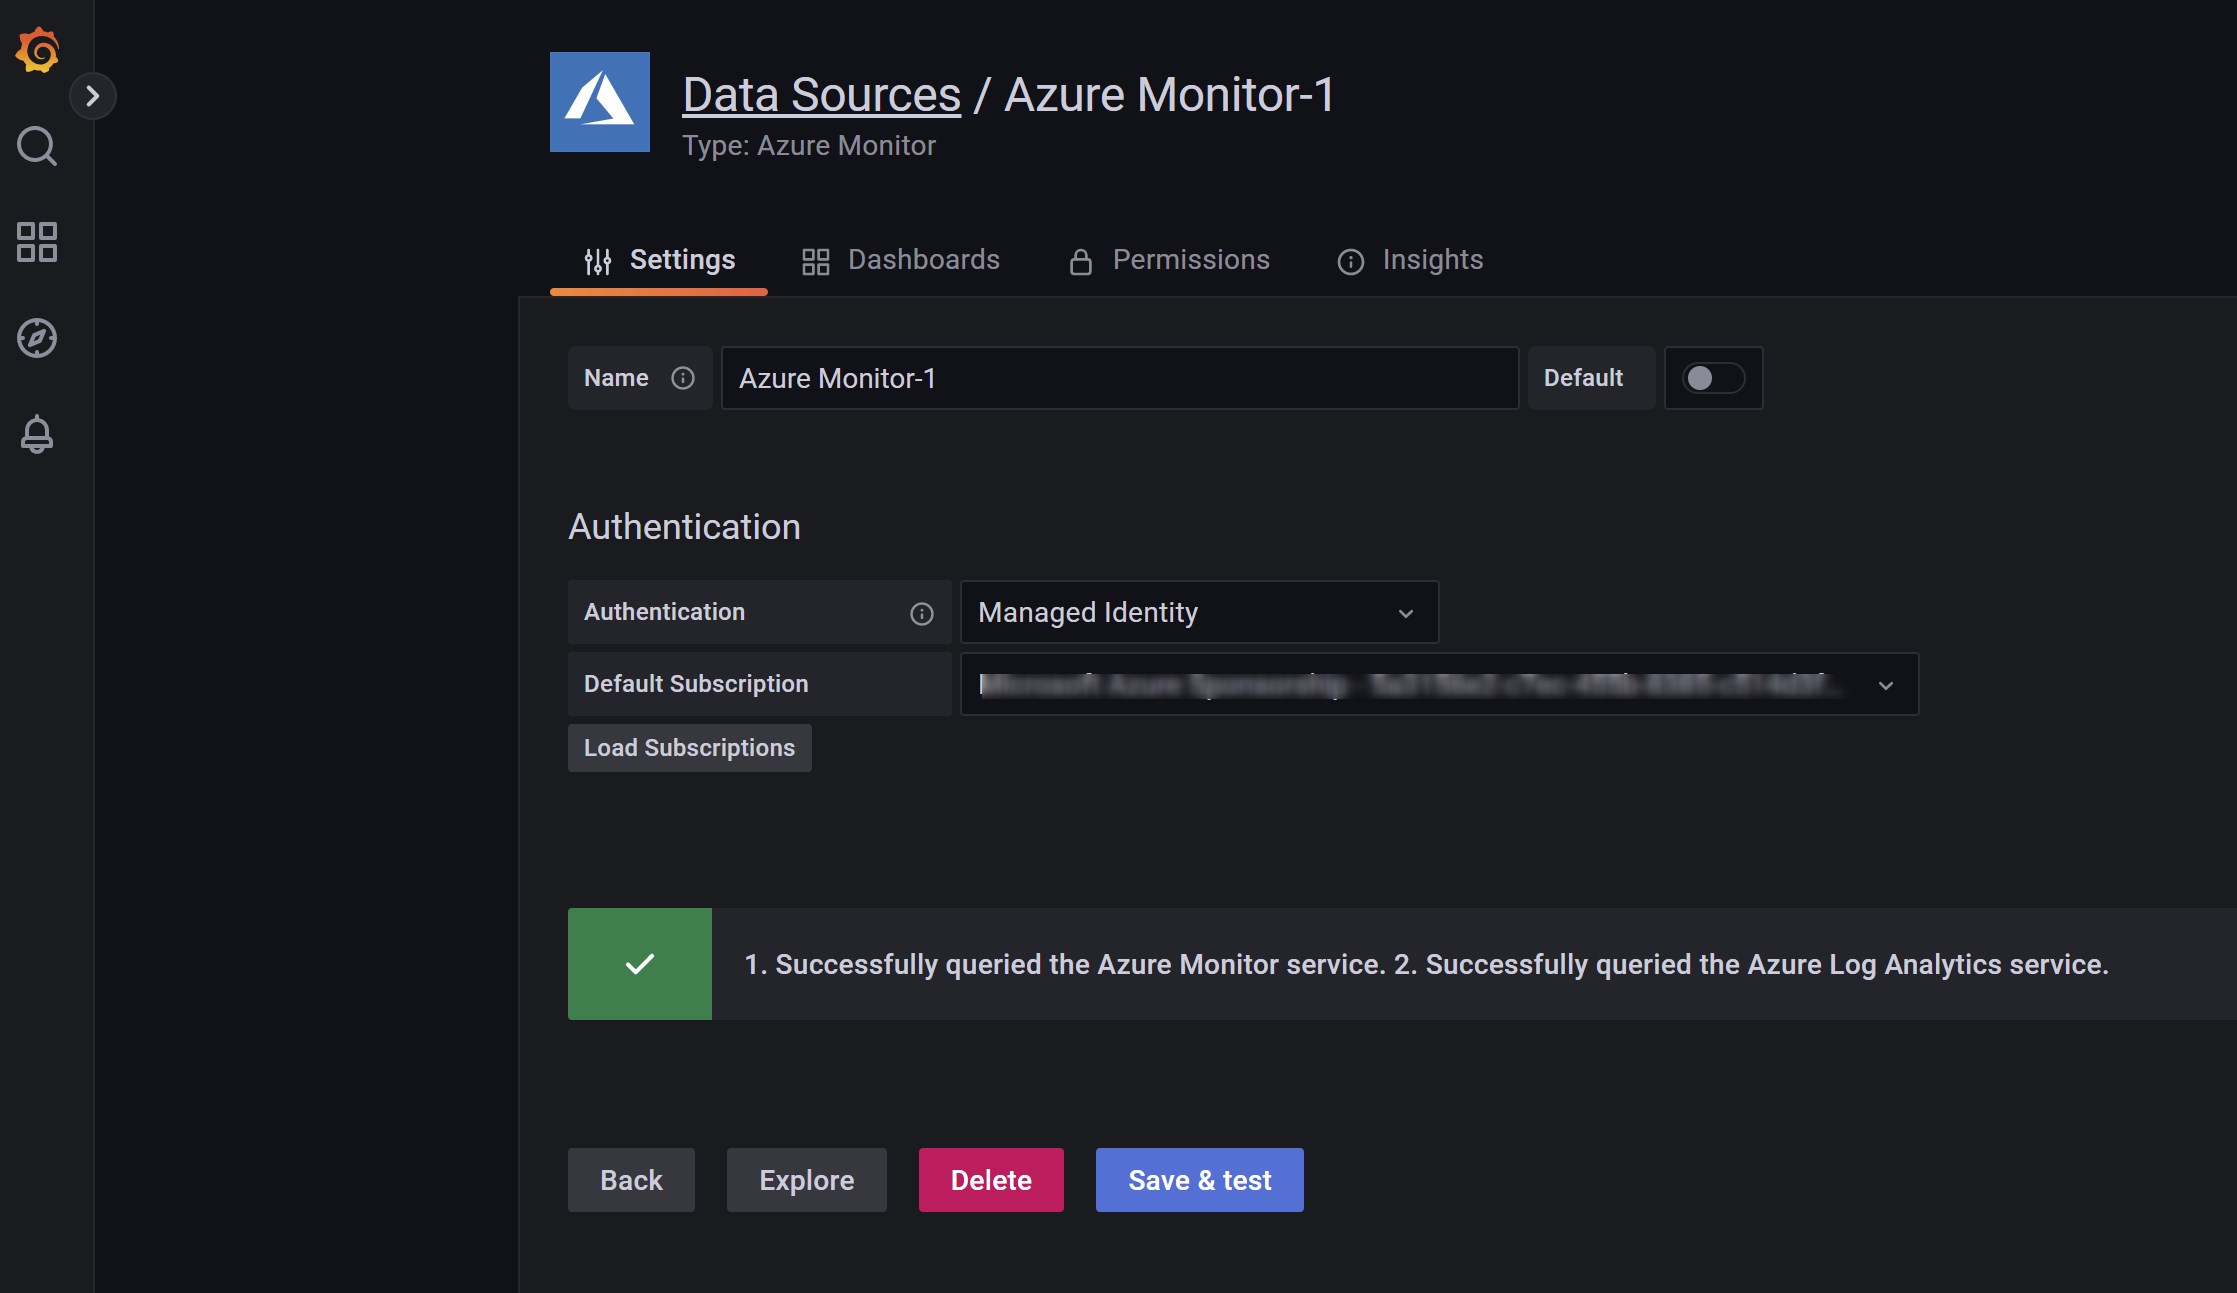
To add a data source, simply click on Add data source and select the Azure Monitor data source you want to use. Then click on Save & test:

If the connection is correctly established, you will see a message like the following:
Now you can click on New dashboard to start creating a new Grafana dashboard:

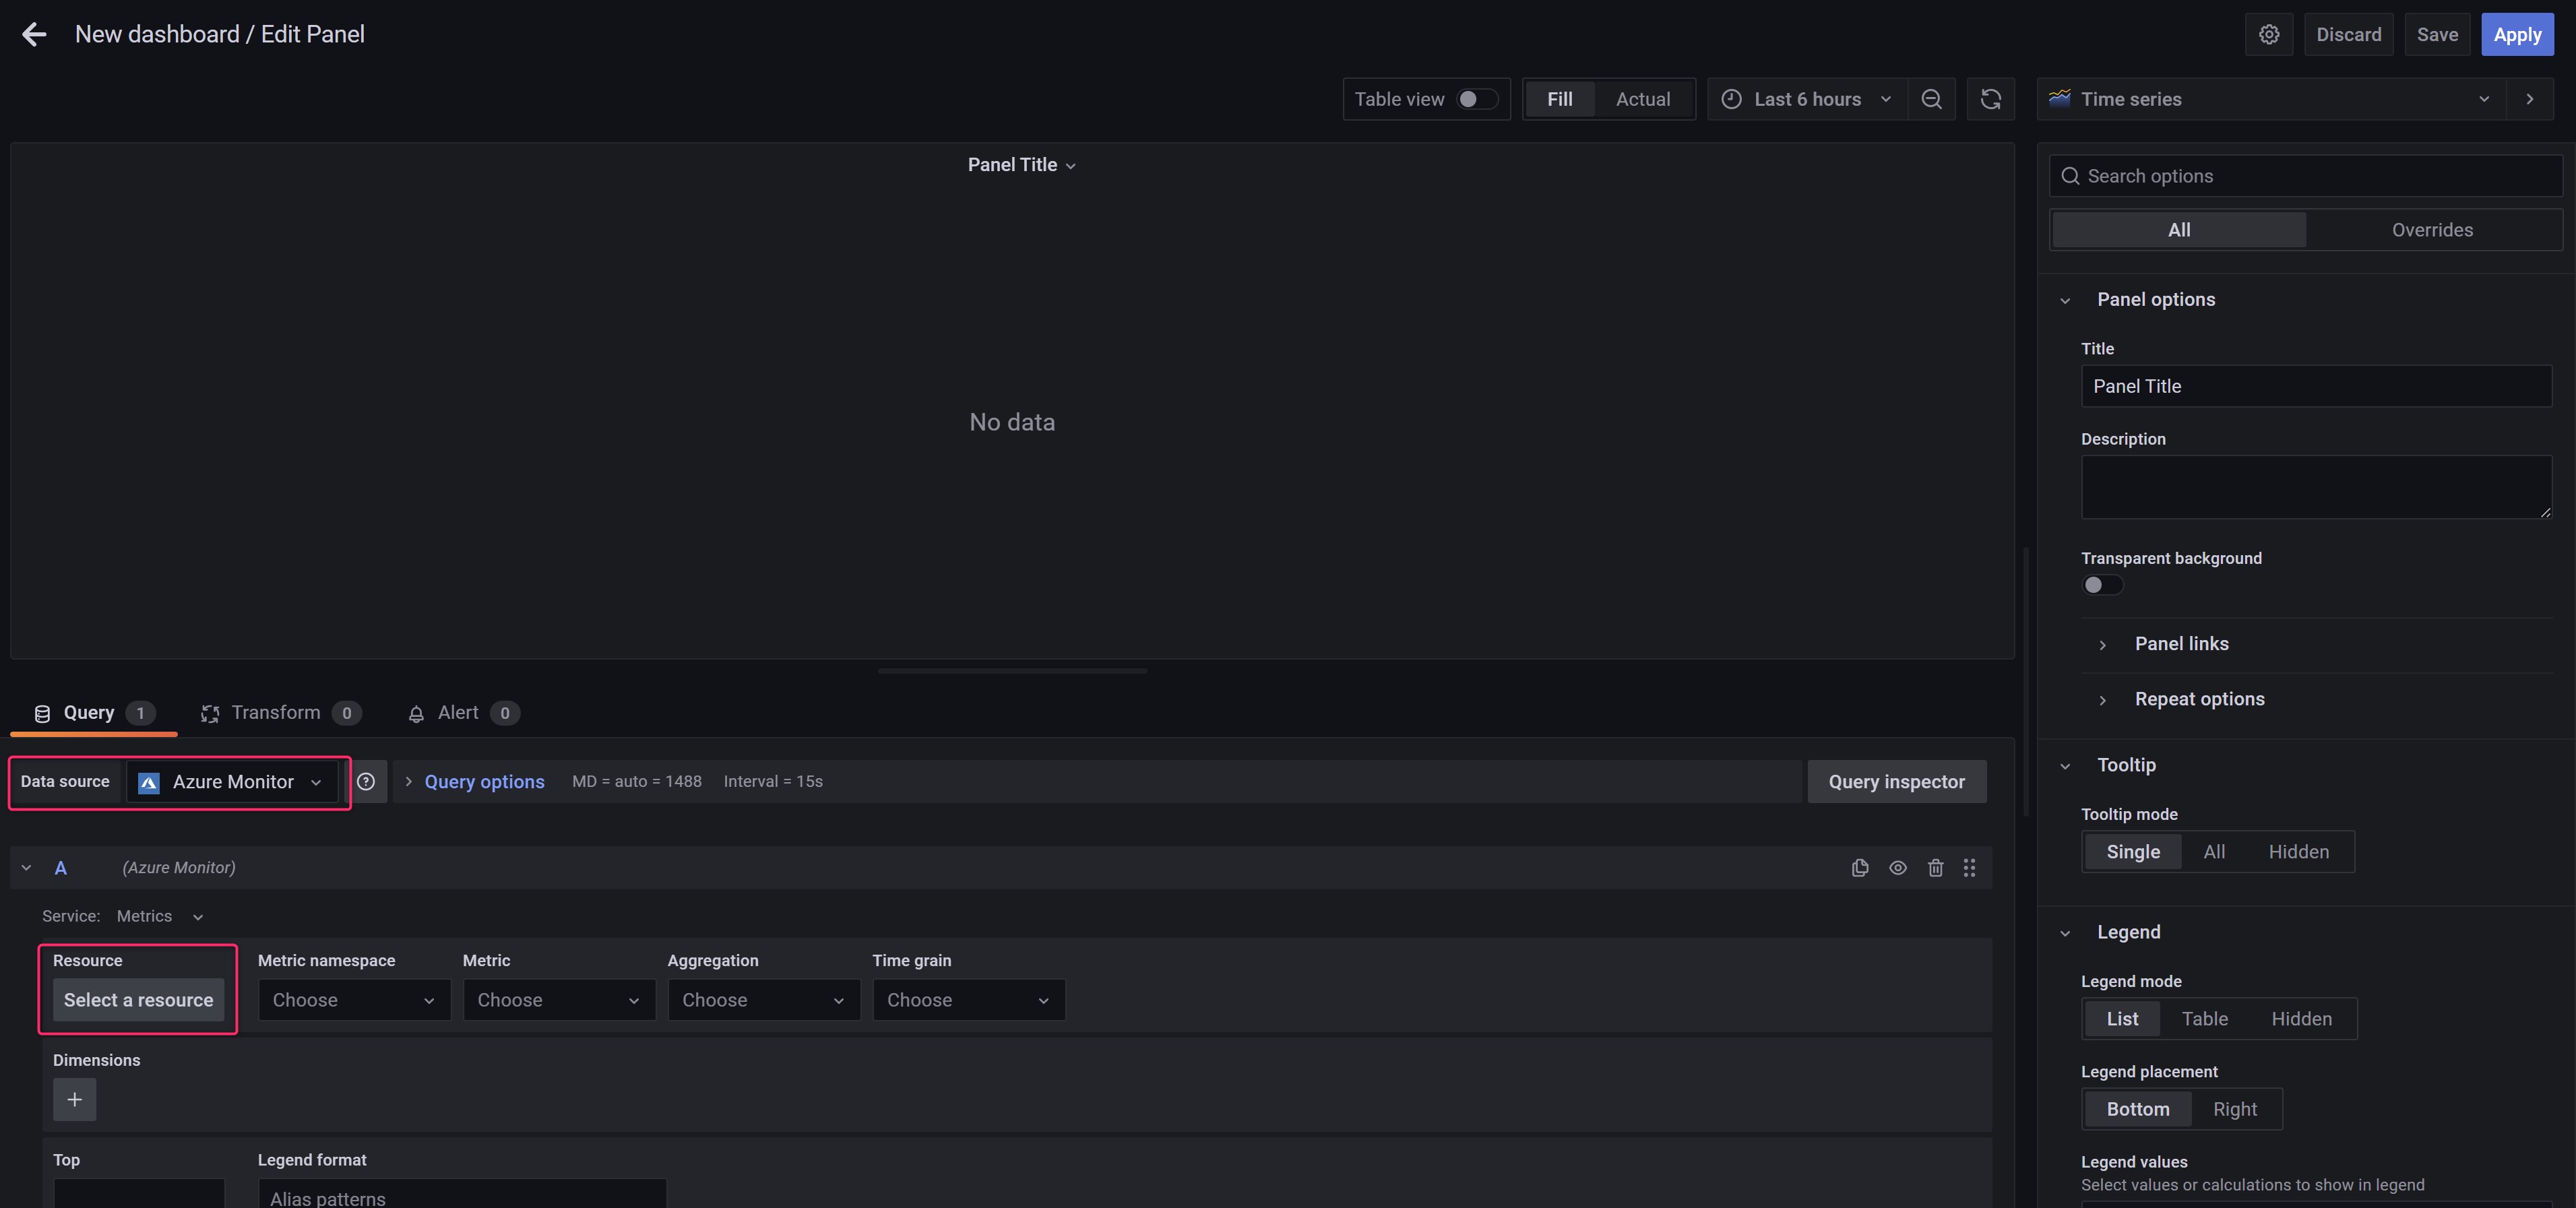
In the dashboard creation page, you can add a new panel where to insert you chart or table with data:

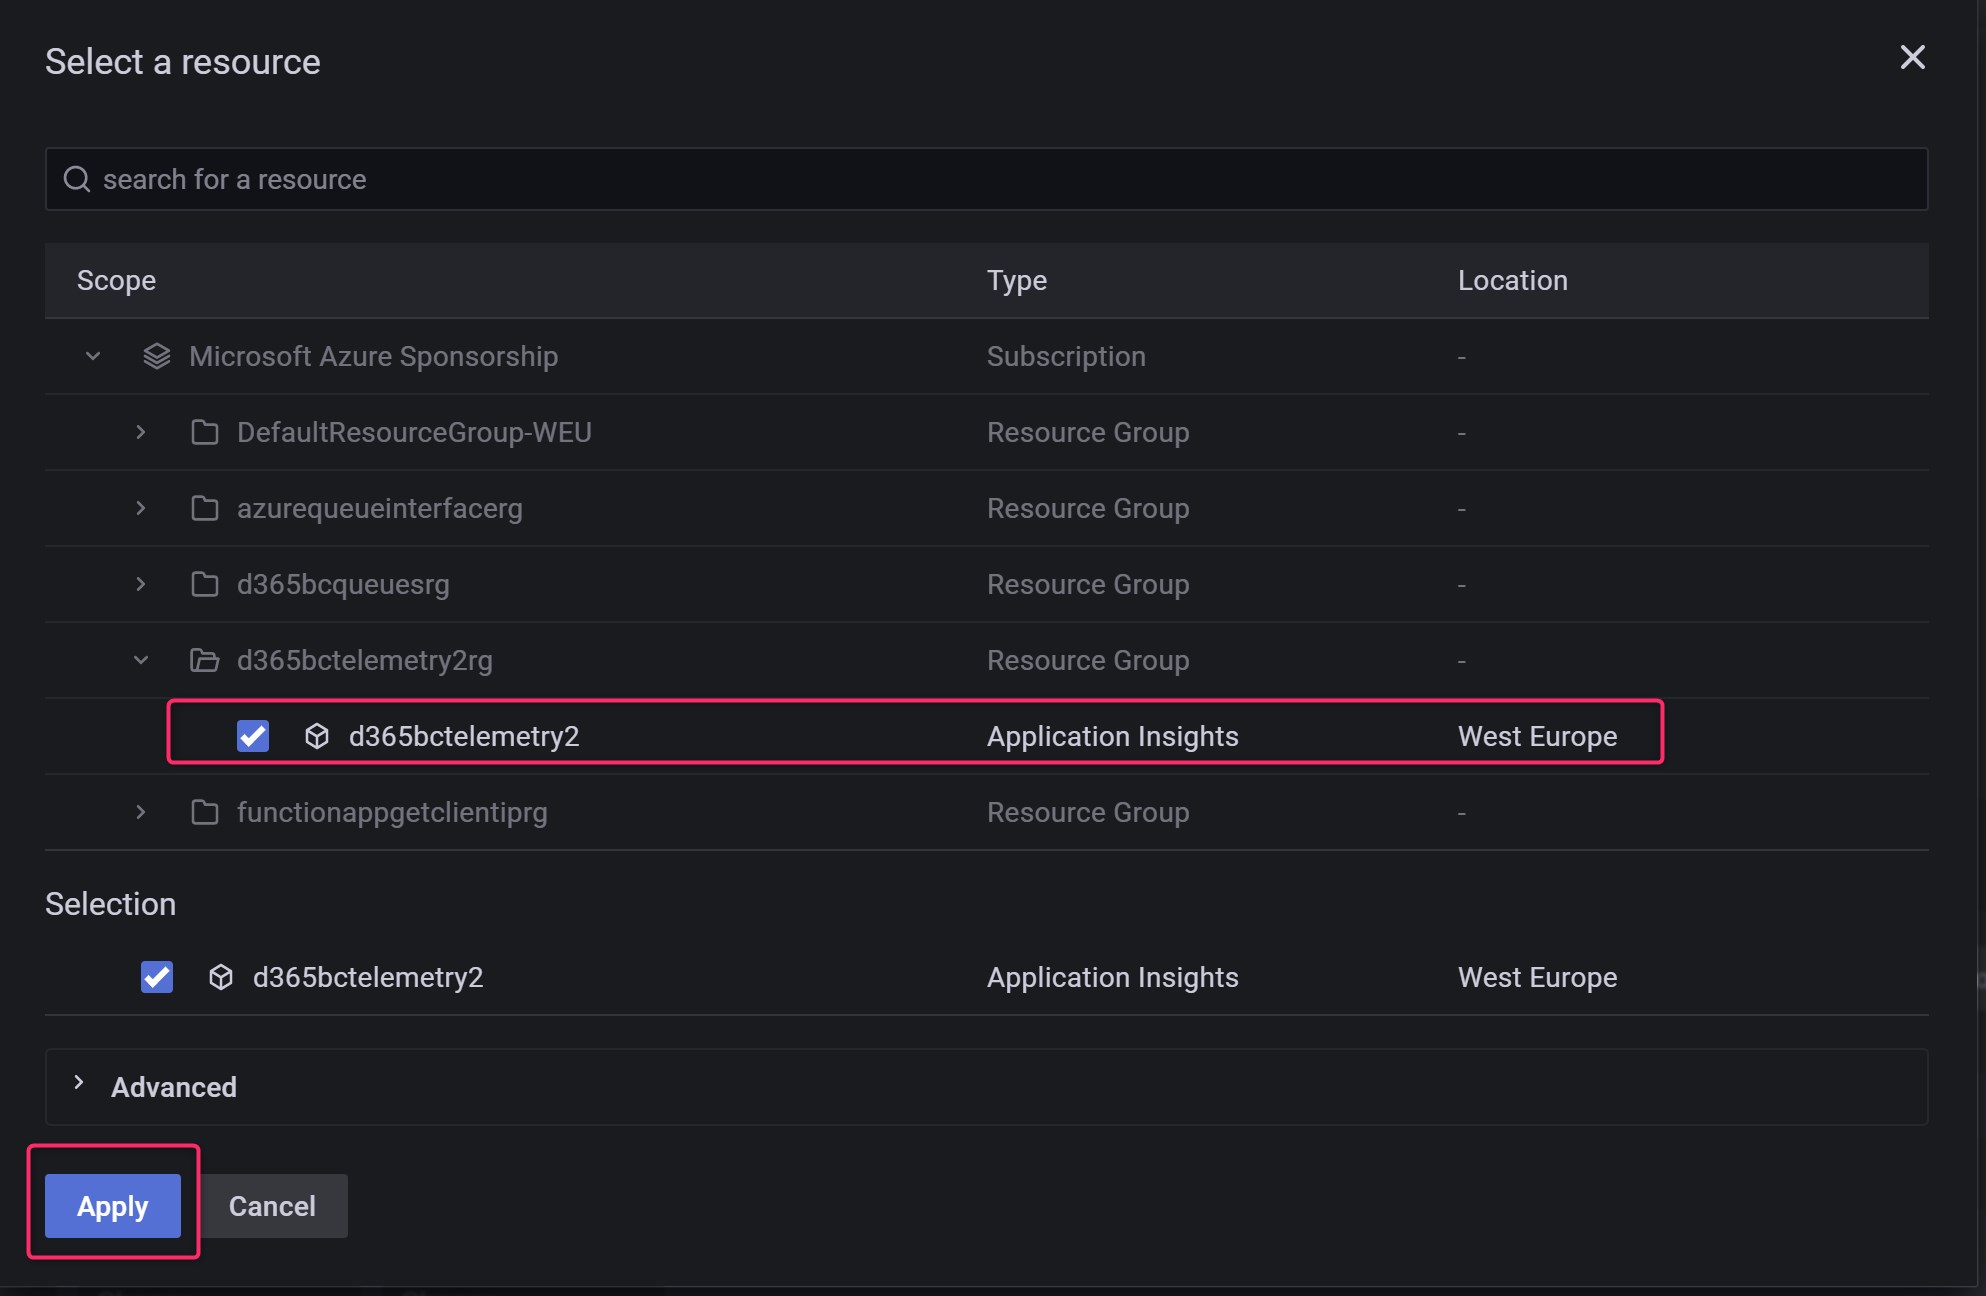
Now select the Azure Monitor data source previously configured and then click on Select a resource:
Here select your Azure Application Insights instance and click on Apply:
Now select the metric that you want to analyze (here for example I’ve created a time chart with the number of traces injected from Dynamics 365 Business Central during the day with a time frame of 15 minutes:

You can customize the chart, the legend and more in order to have a visually appealing chart.
And what about if I want to analyze a custom KQL query? Select the data source and then select the Query panel. here you can write your KQL query (in this case I’m using a query that shows the long running AL methods):
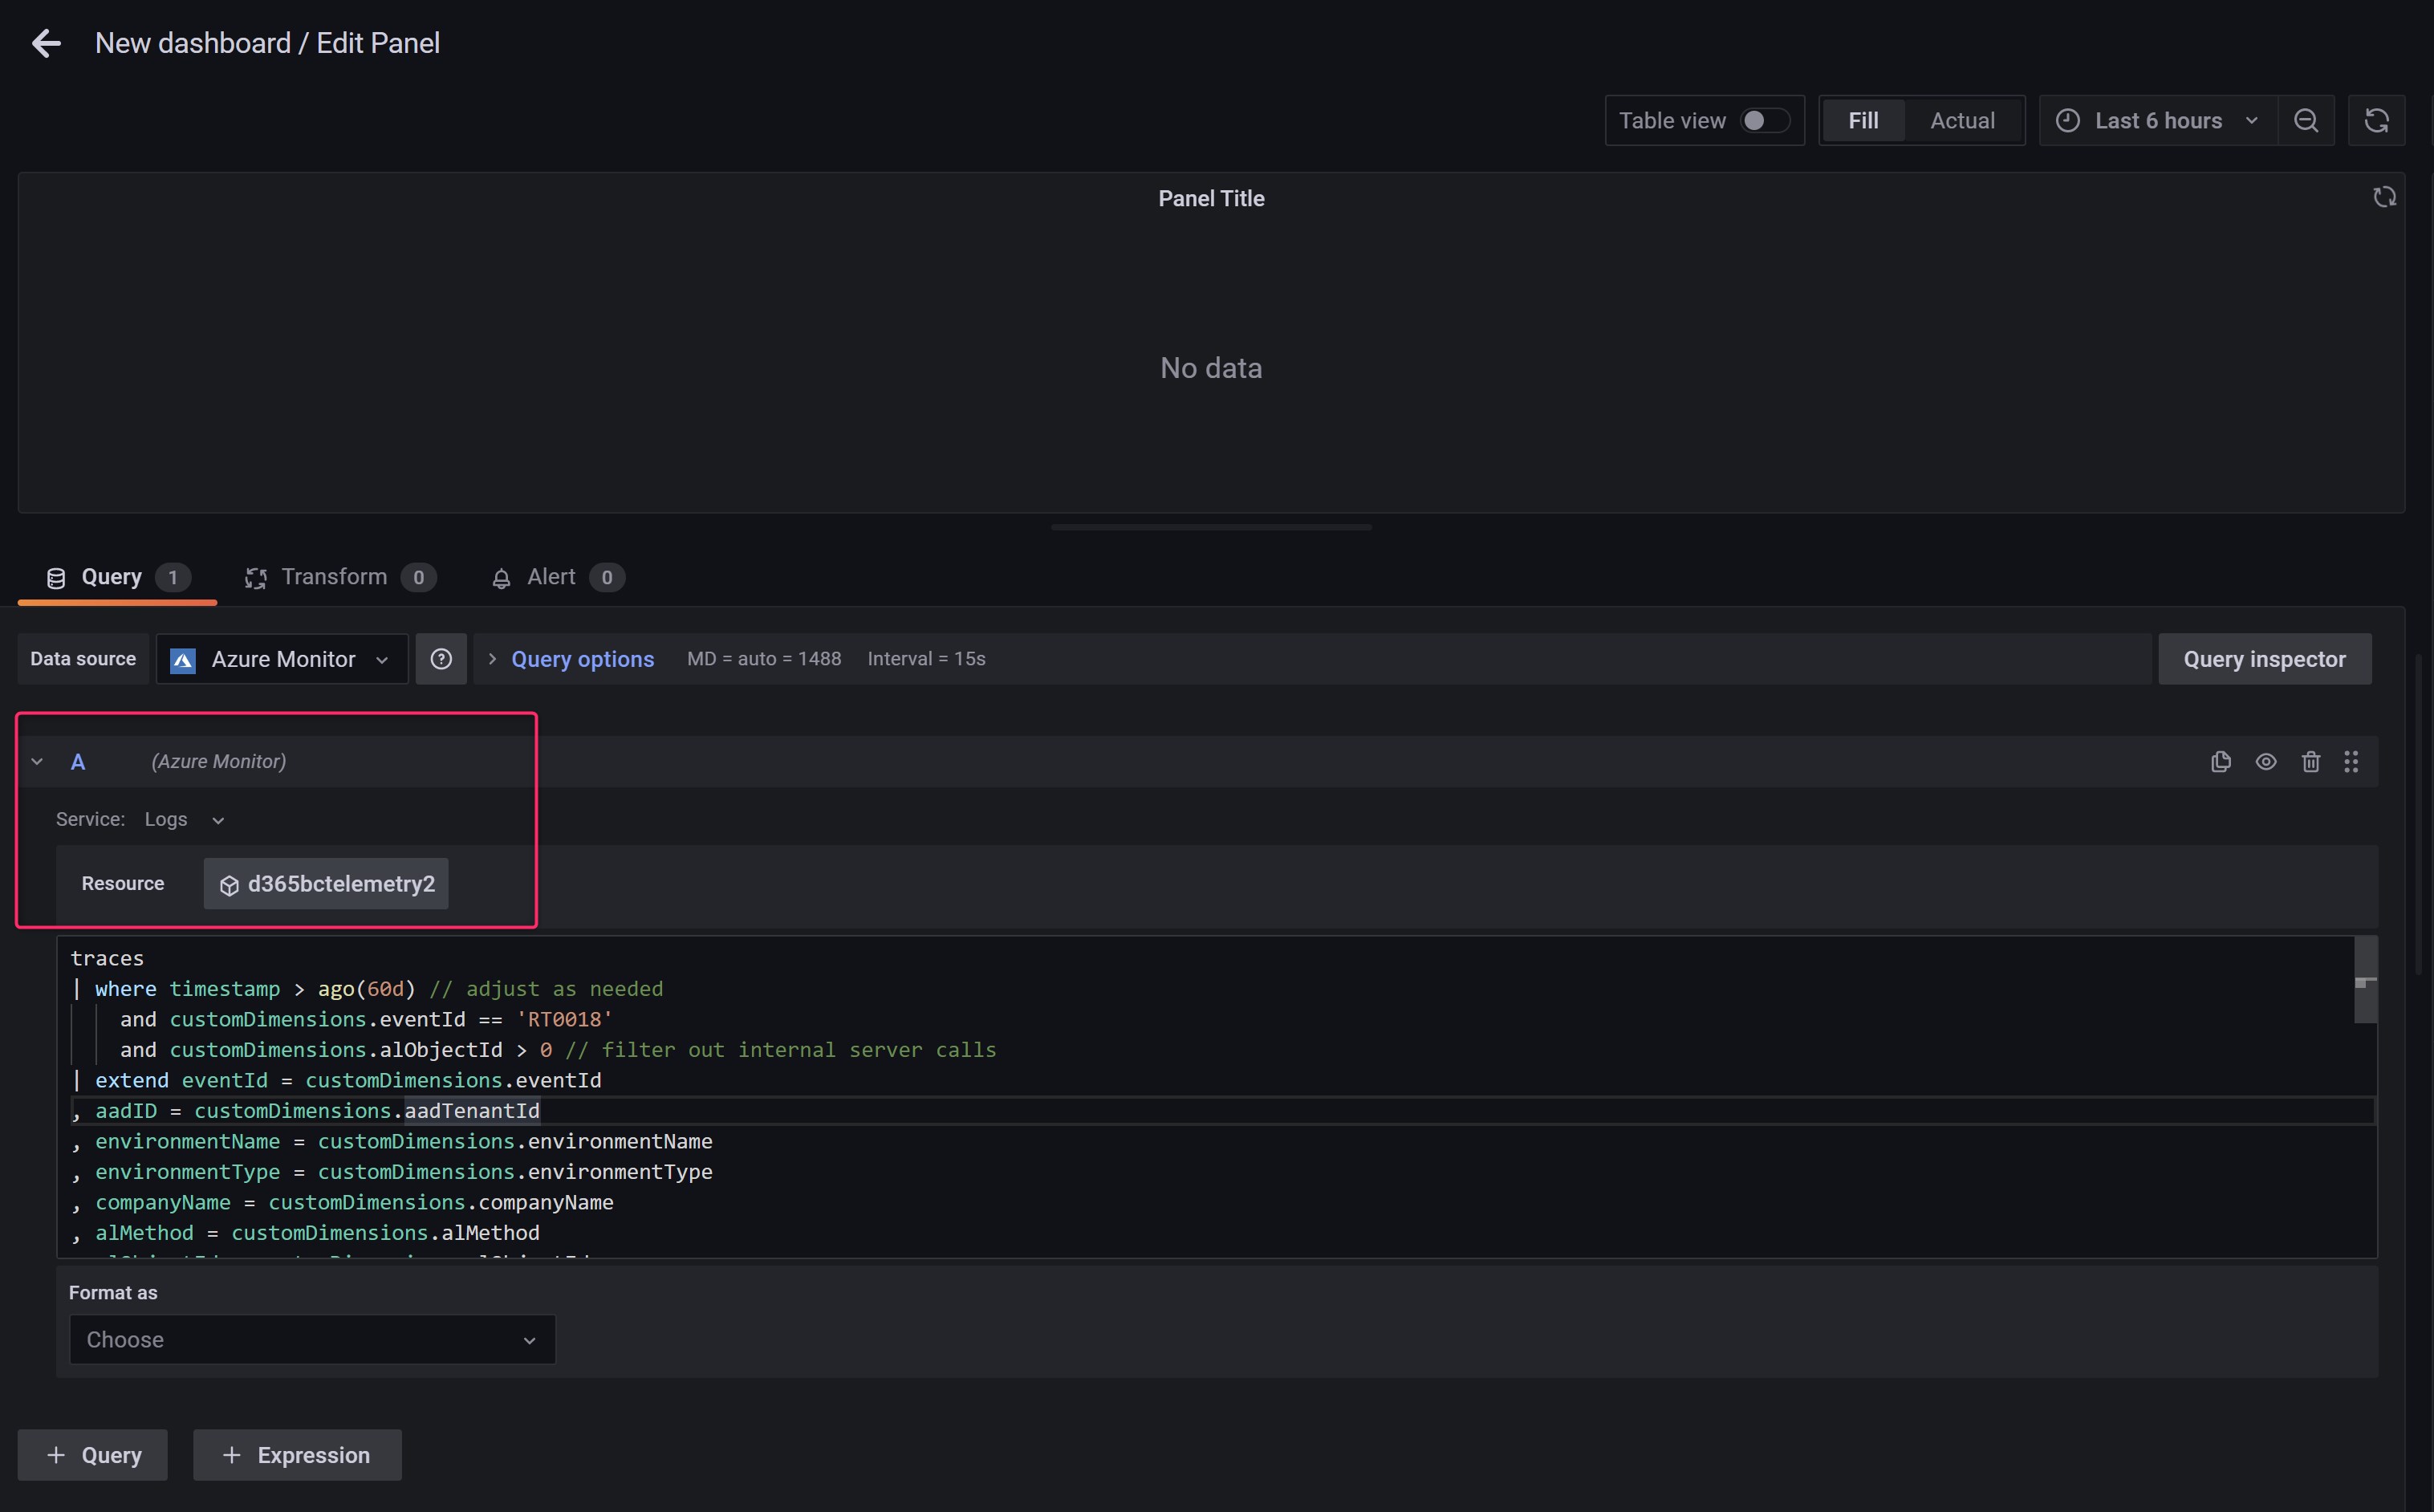
When done, the query results are displayed. You can show them as a chart or as a table (by selecting the table view toggle on the top of the result pane):

When all is ok, you can save your query analysis and add it to the dashboard:
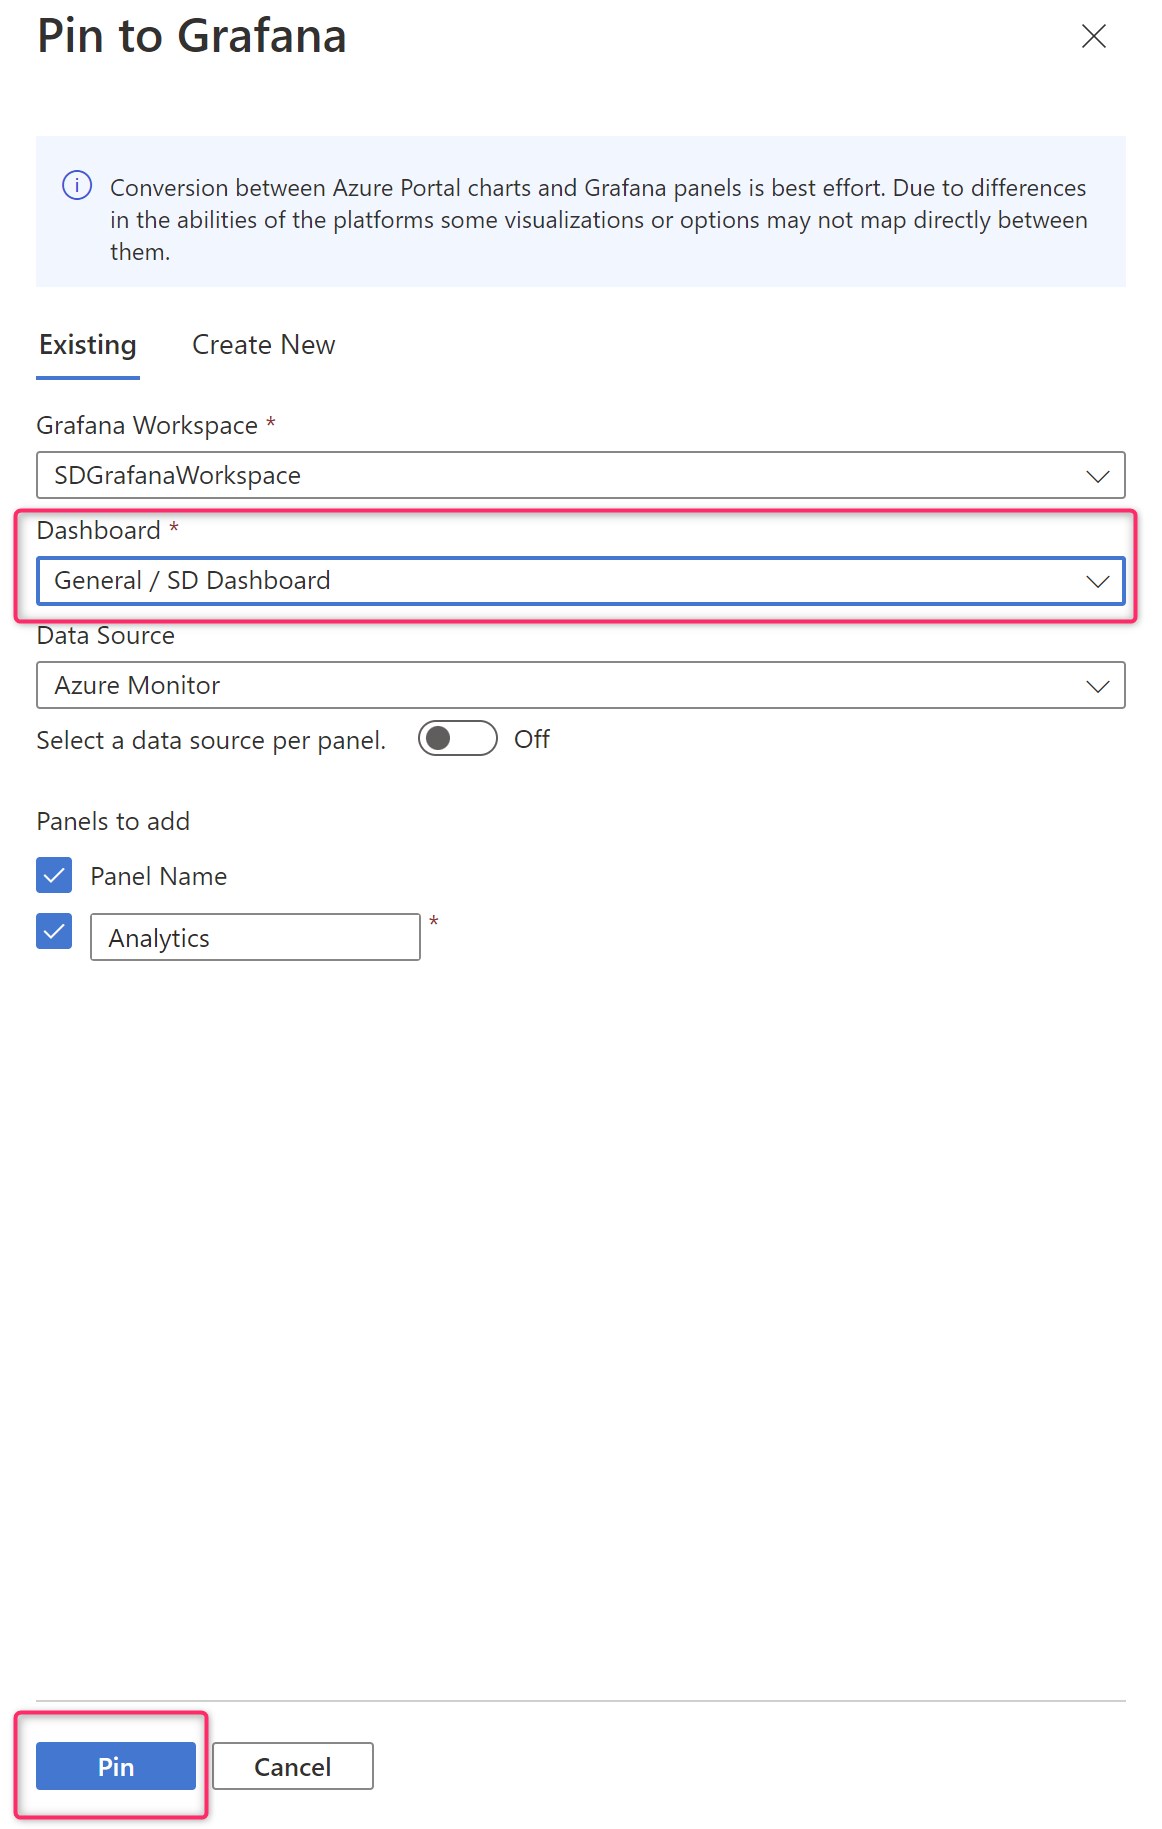
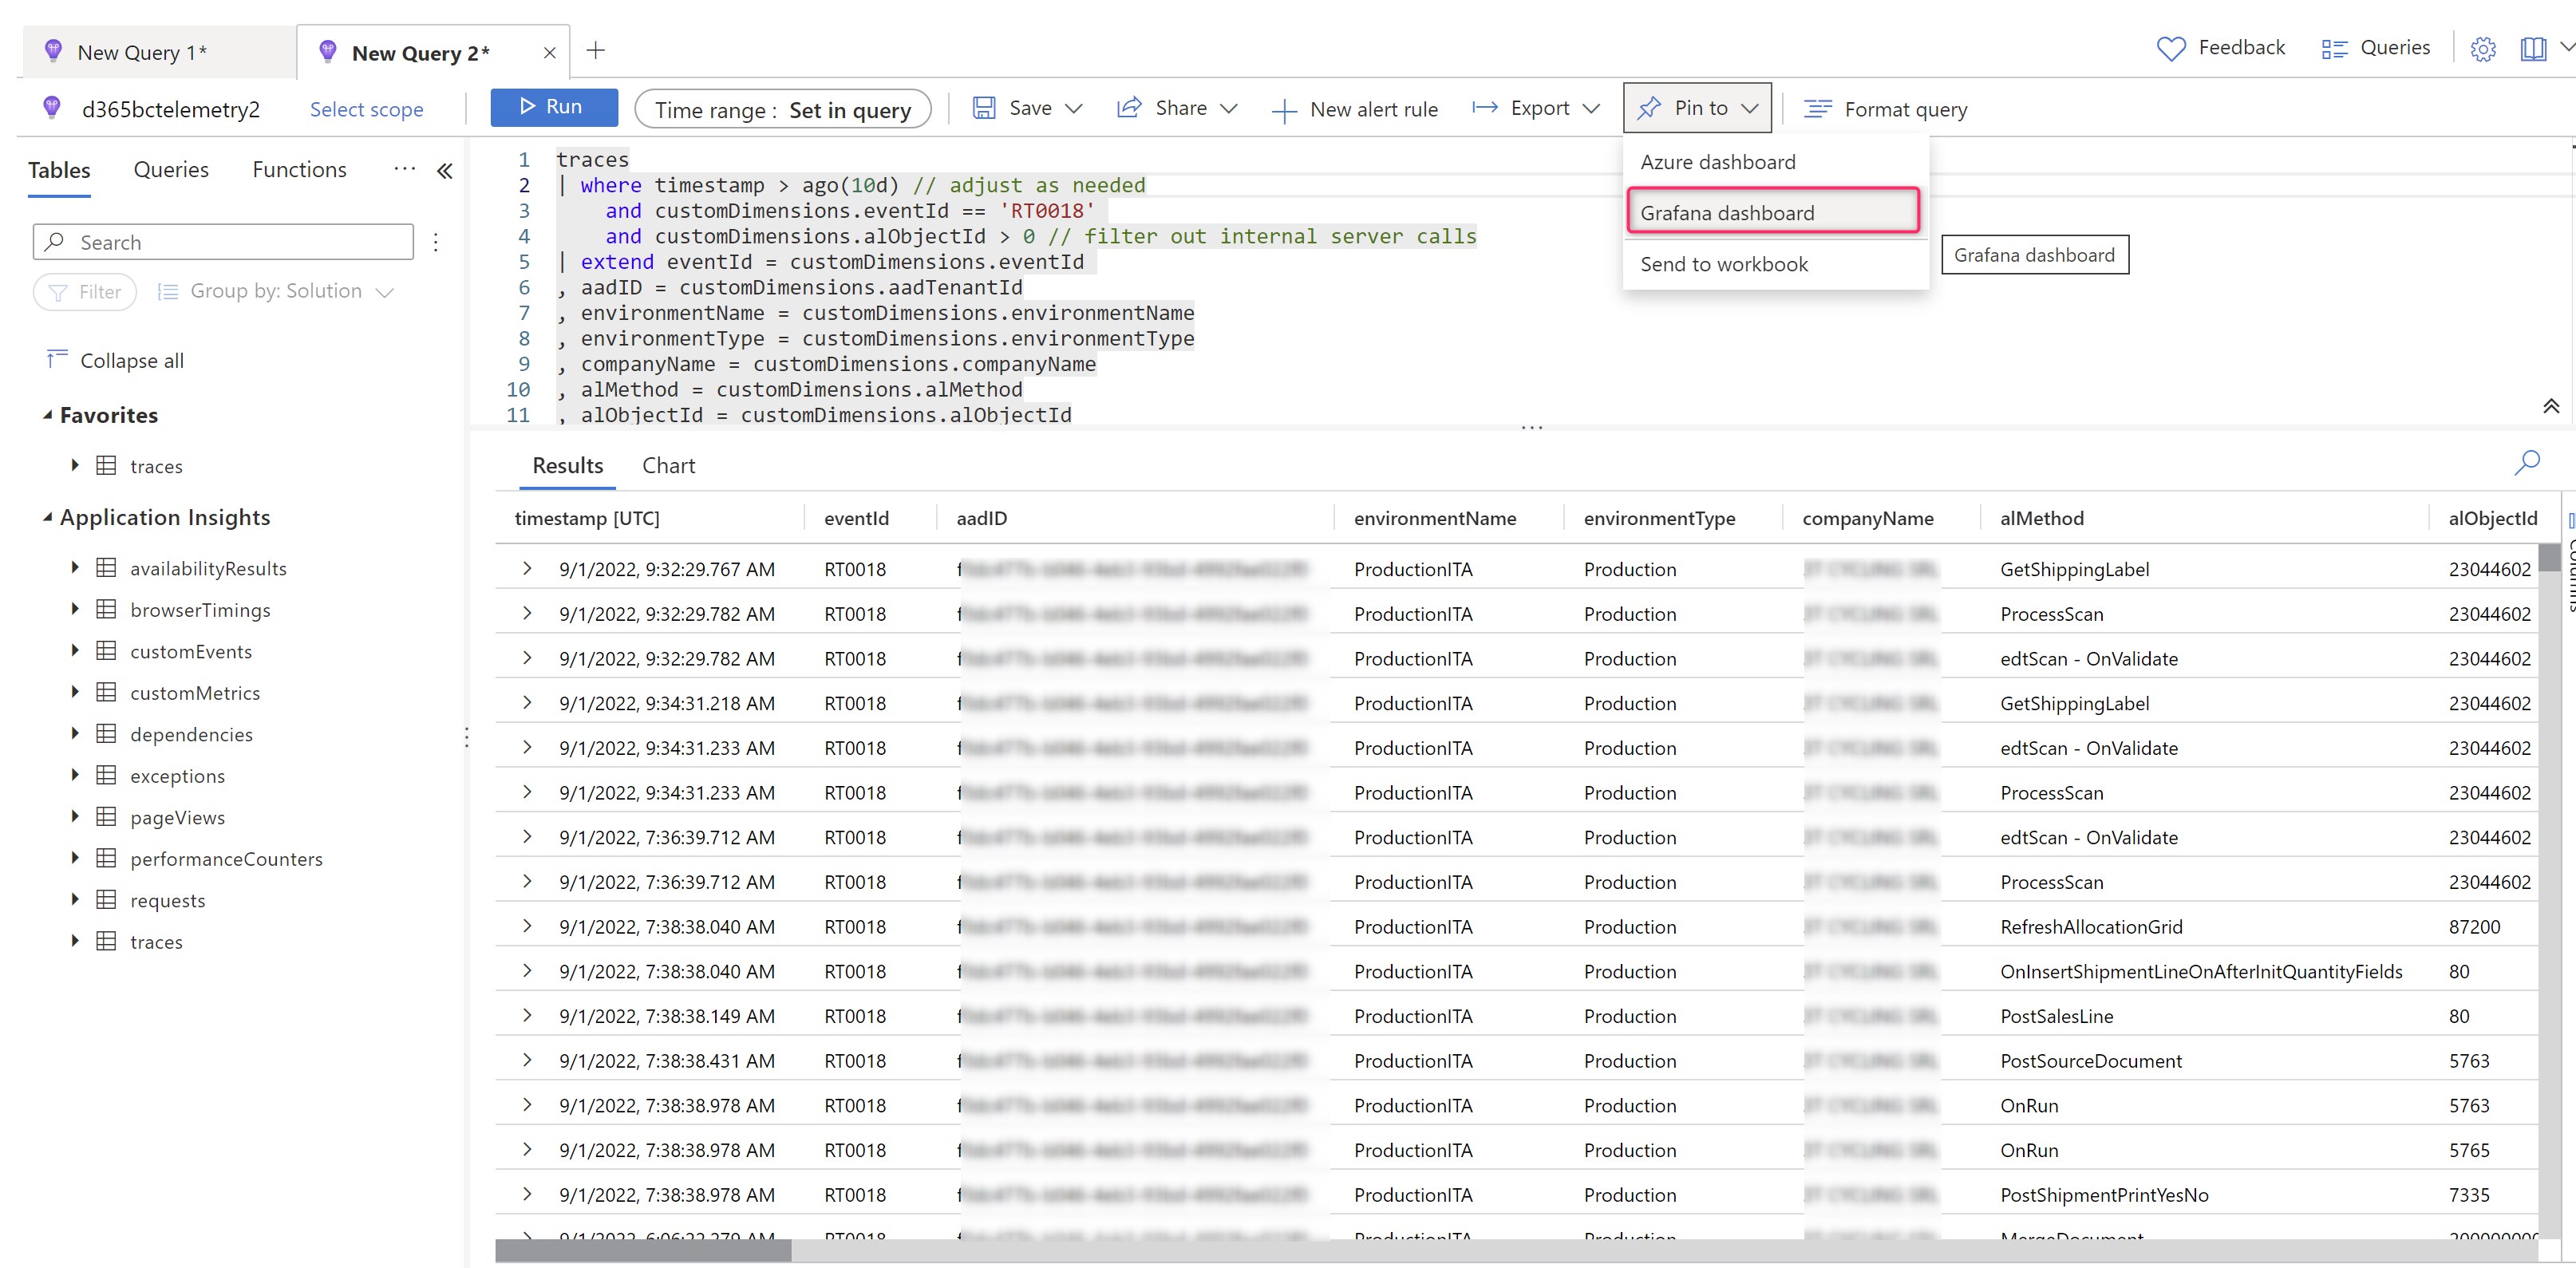
In addition to building your panels in Grafana, you can also quickly pin Azure Monitor visualizations from the Azure portal to new or existing Grafana dashboards by adding panels to your Grafana dashboard directly from Azure Monitor. To do that, from your Application Insights instance, select Logs and execute a KQL query. Then click on Pin to and then select Grafana dashboard:

You can now select your Grafana dashboard where you want to add your query result and you can select the panel where to add those query:
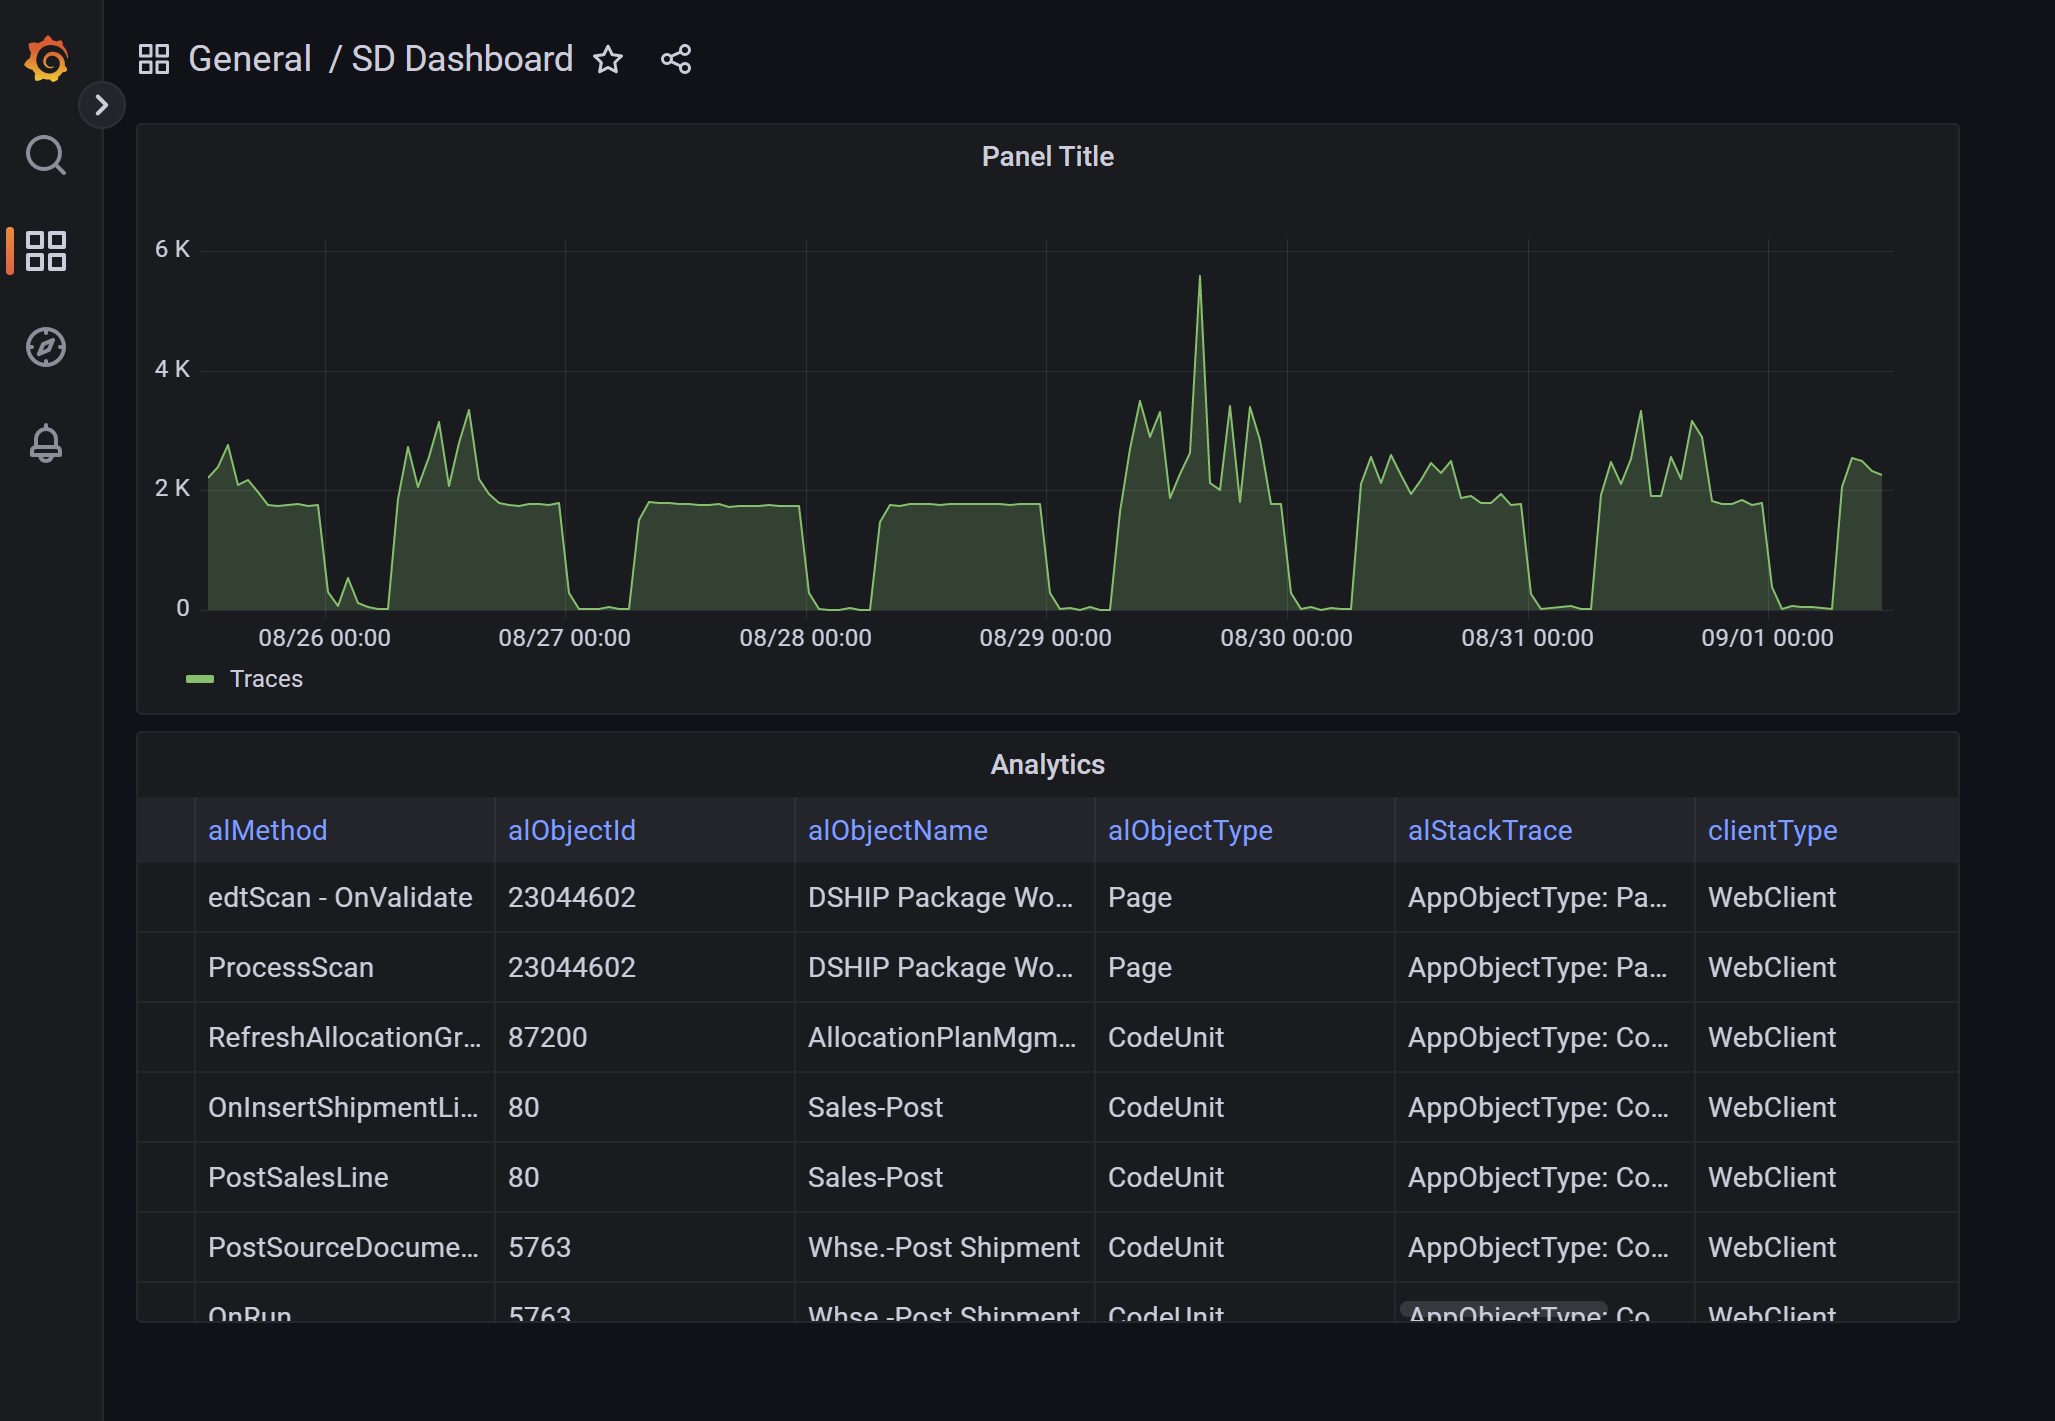
You can also pin to a Grafana dashboard tabular results that comes from Application Insights (not only charts). here for example I’m executing the Long Running AL KQL query from Application Insights Logs (tabular result) and then I pin these results to my Grafana dashboard:
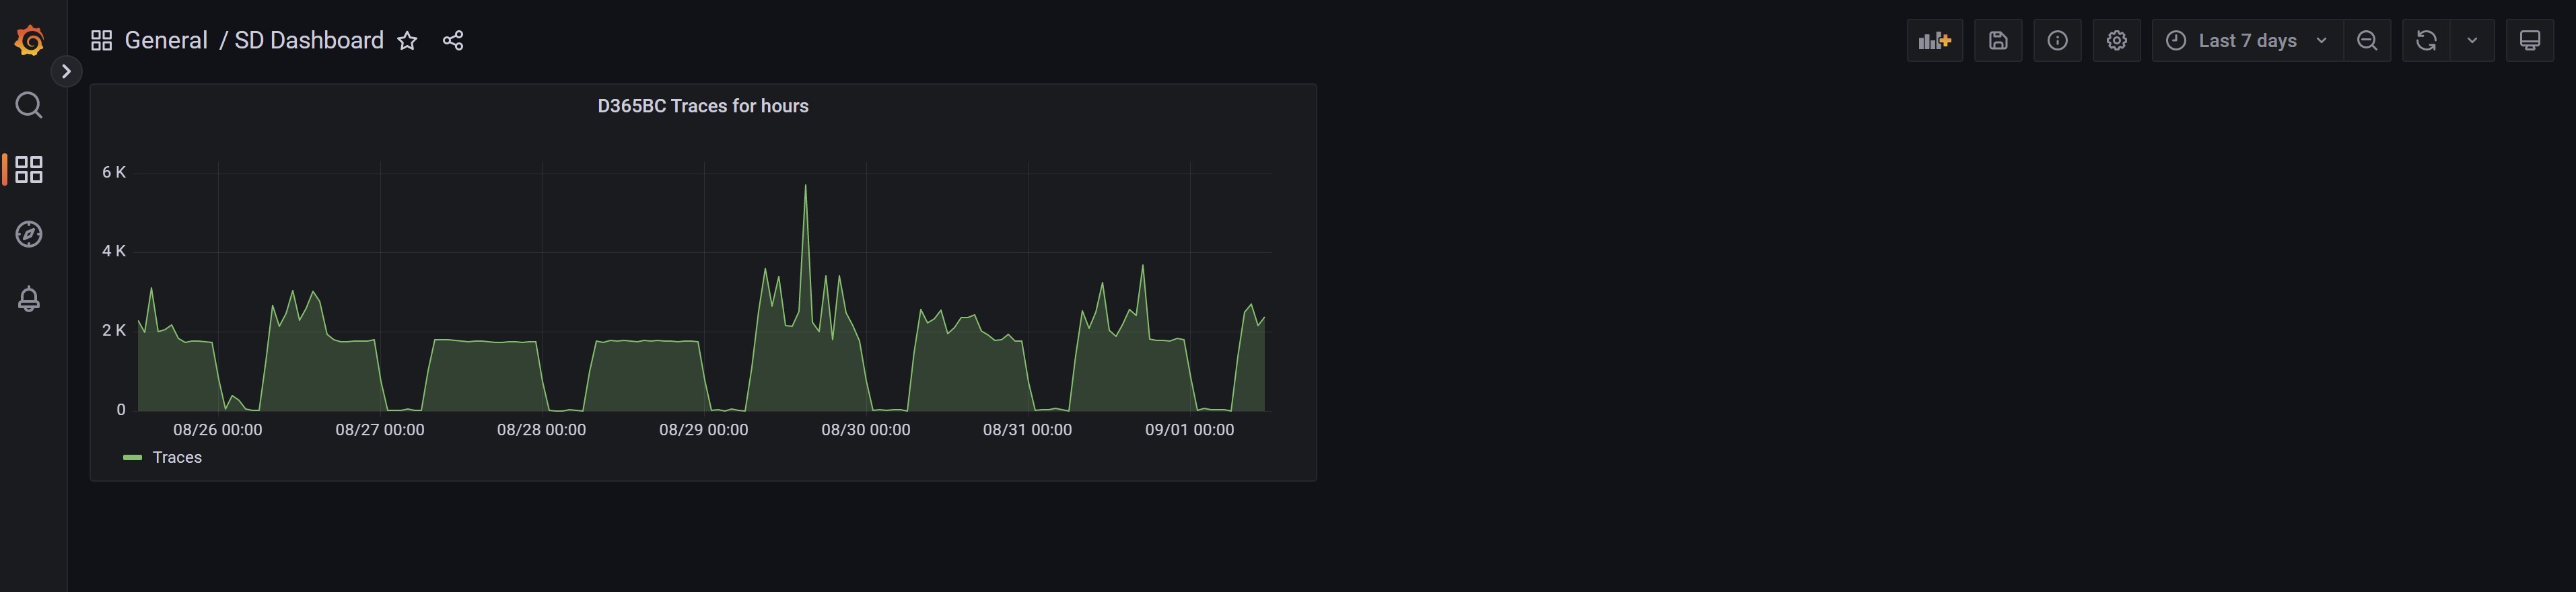
As a result, the table is added to the Grafana dashboard in the specified panel:
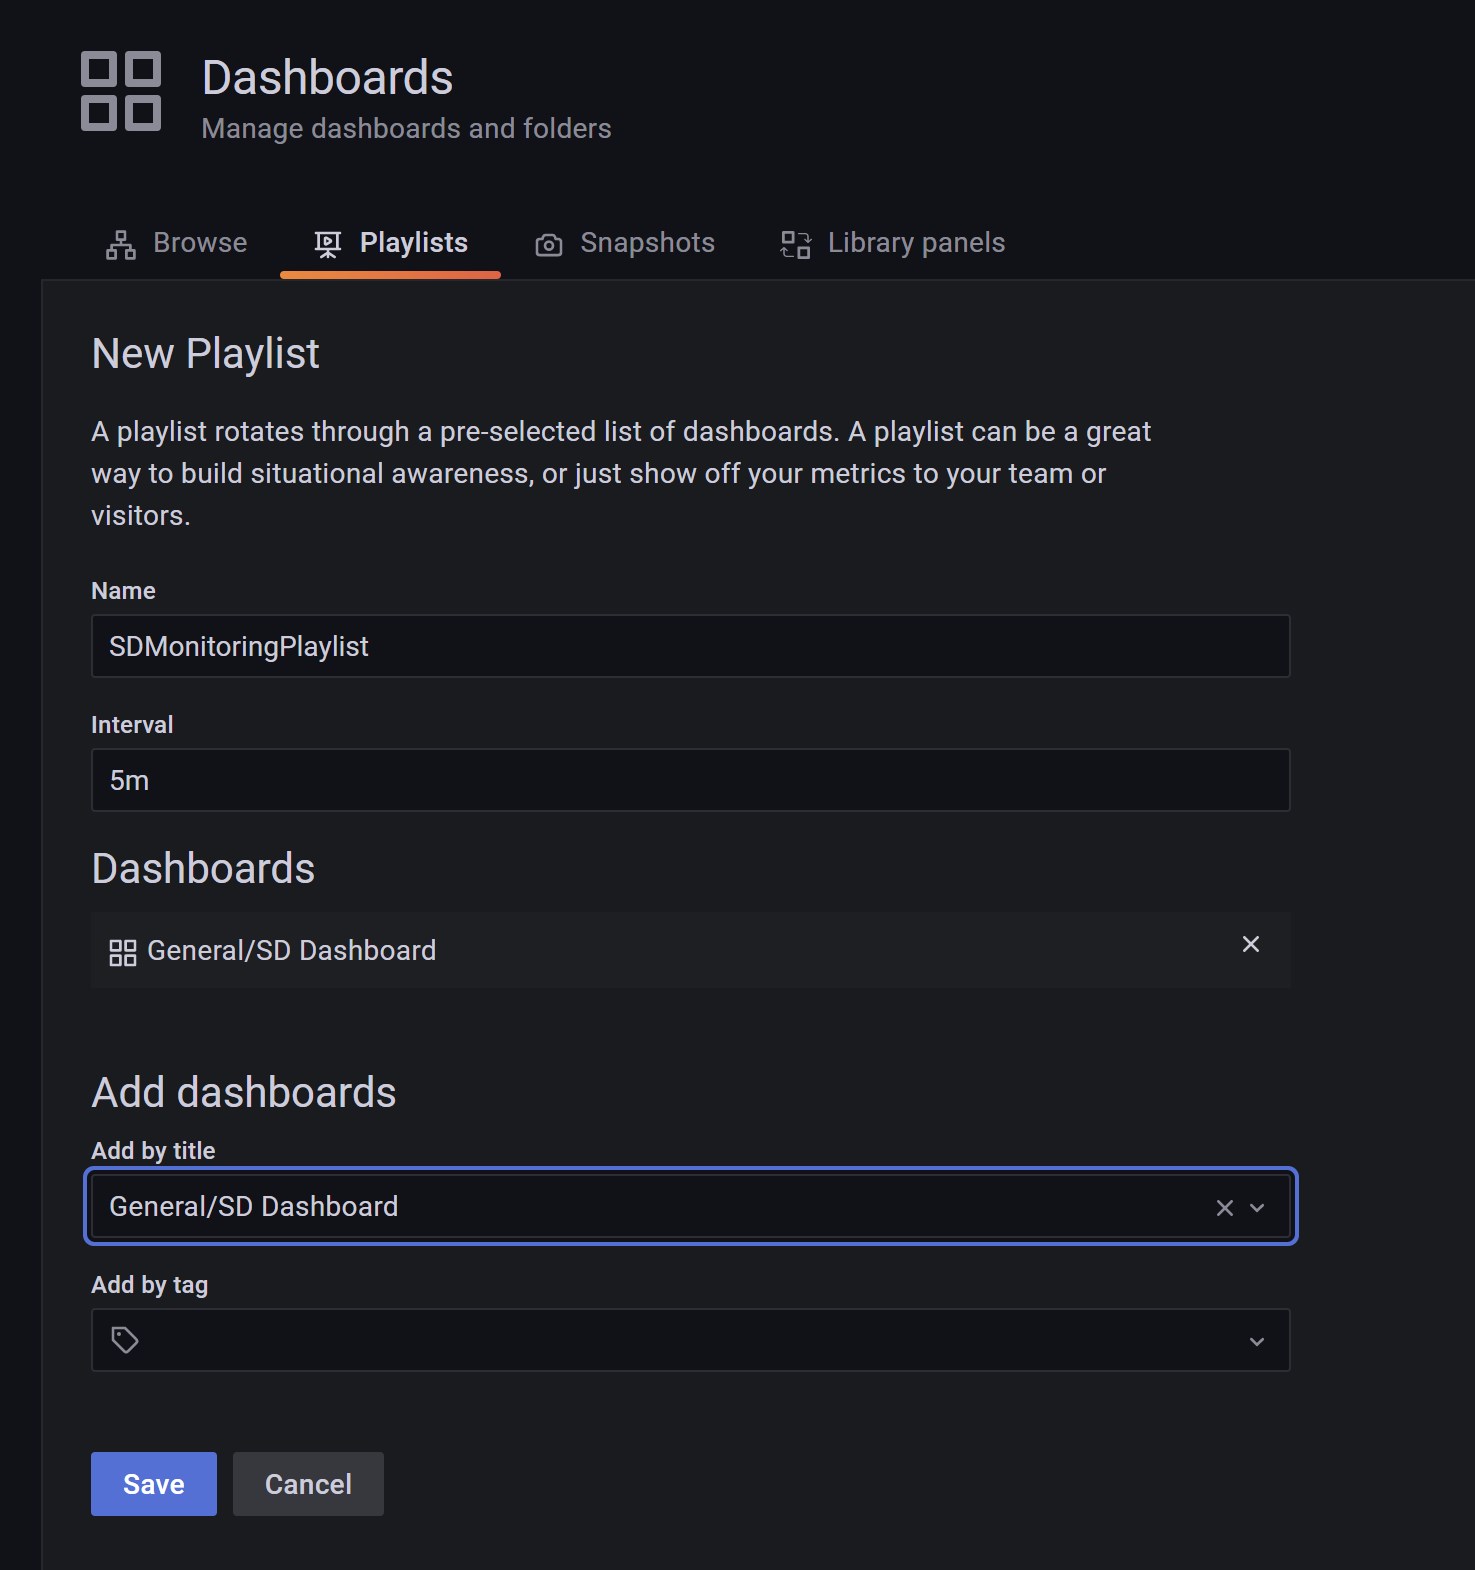
Another interesting feature of Grafana is the possibility to create a dashboard playlist. You can create multiple dashboards and add them to a playlist configuring an interval for each dashboard to show. Then you can Play the created playlist to see the dashboards cycle through. This could be interesting to create a centralized “company monitoring” experience and display the results on a large monitor on a wall.
To create a dashboard playlist, select Playlists from the Dashboards menu:

Then select the playlist name, the time interval to rotate dashboards and then add the dashboards that compose the playlist:
What I love about Grafana?
As you can see, Azure Managed Grafana is quite powerful.
I think that the most interesting Azure Managed Grafana feature is the possibility to configure multiple data sources (external storage backend that holds your telemetry data) and Azure Managed Grafana supports today lots of popular data sources (Microsoft and non-Microsoft) like Azure Monitor, Azure Data Explorer, SQL Server and Azure SQL, MySQL, Google Cloud Monitoring, CloudWatch, Alertmanager, Elasticsearch, Grapite and many more.
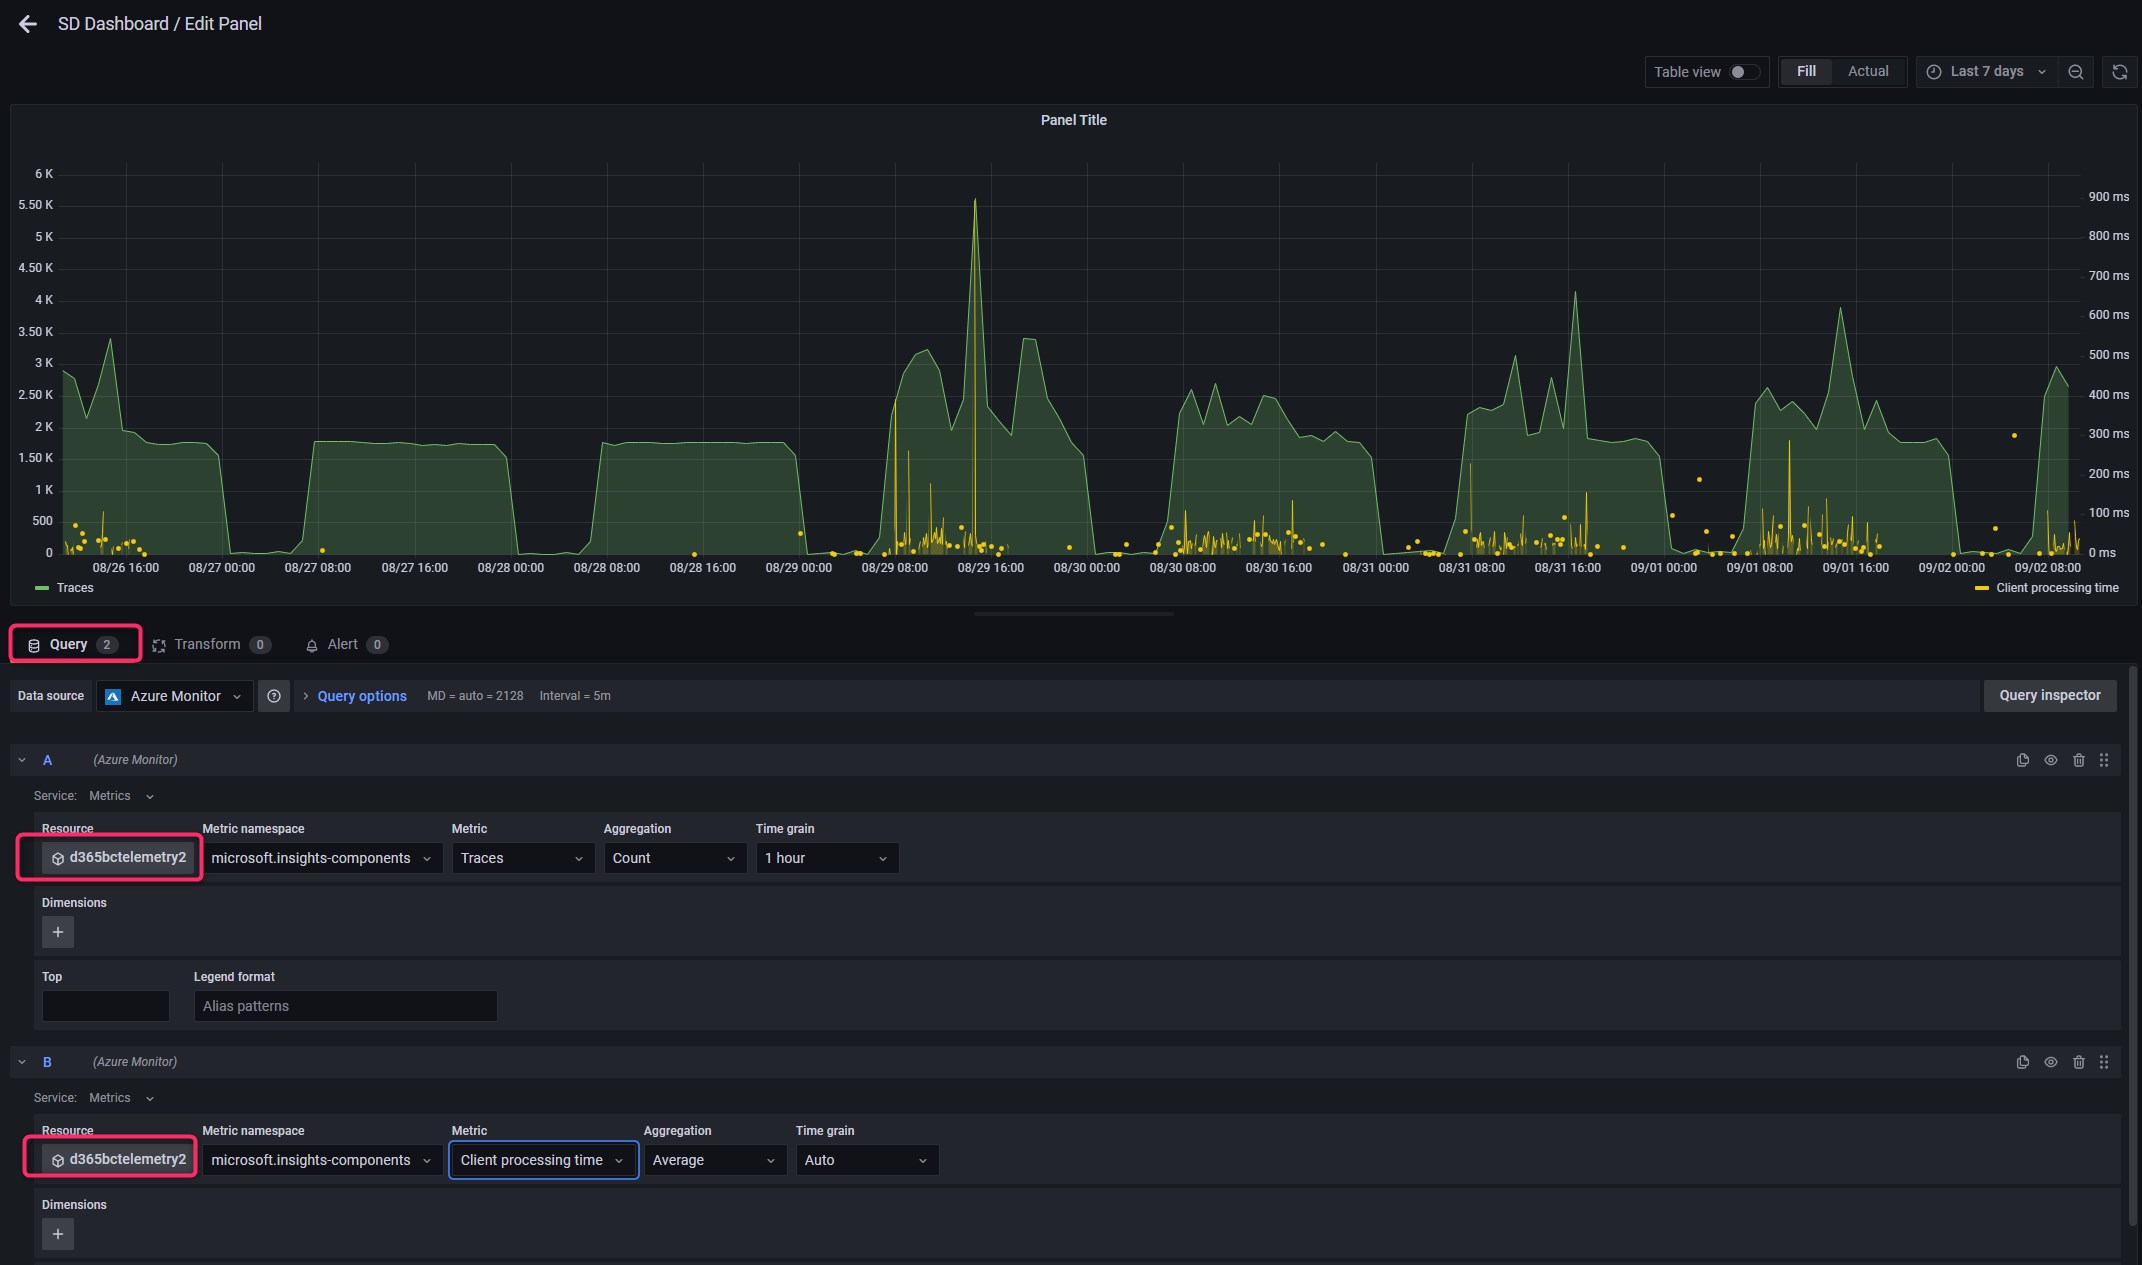
As said before, in a Grafana chart (or analysis) you can add multiple queries from multiple data sources (the data source here is at a per-query level). This is another feature that personally I love, because on the same analysis you can for example compare metrics that comes from two different sources, like for example 2 different Application Insights instances (alias, two Dynamics 365 Business Central tenants):
Just to show this, in the below chart you can see that in the same chart you can add two queries (here I’ve used the same Application Insight instance because it’s the only one that I’ve active on this environment, but you can select a different one):
An Azure Managed Grafana instance can also be used inside an organization for many scopes (a team can use it for monitoring Dynamics 365 Business Central, another team can use it for monitoring a web application, a support team can use it for monitoring customer issues and more). Azure Managed Grafana enables such sharing by allowing you to set the custom permissions on an instance that you own.
Azure Managed Grafana supports the Admin, Viewer and Editor roles. In particular:
- The Admin role provides full control of the instance including viewing, editing, and configuring data sources.
- The Editor role provides read-write access to the dashboards in the instance.
- The Viewer role provides read-only access to dashboards in the instance.
The Admin role is automatically assigned to the creator of a Grafana instance. Grafana user roles and assignments are fully integrated with the Azure Active Directory.
What about pricing?
Grafana has a price for instance for active users. For more details about pricing, please go here.
Please remember that if you’ve setup a Grafana environment on Azure, you are charged when resources are running whether you are using them or not. To avoid incurring additional charges, if you’re not using a Grafana instance please delete it.
