

When introducing the upcoming features of Dynamics 365 Business Central 2022 Wave 1 (version 20) I wrote that one of my favourite features of the upcoming release is the possibility to create Excel layouts for reports (standard or custom ones).
How many times in real world projects a customer asked you to create custom exports in Excel in order to fill a pre-defined and pre-formatted Excel report (with formulas, charts, macros and more) or to create an Excel report exactly like in a given model? Personally, I’ve lost the count…
Now with the new Excel Layout feature, this is possible directly at customer’s fingertips.
How do Excel Layout works?
To show how this new feature works, I start with one of the standard Dynamics 365 Business Central report: Customer – Sales List (report id = 119). As said before, you can use this feature with every report, standard or custom. Obviously, please consider that not all standard reports have a dataset that is optimized to be used for an Excel report. Some of them are using aggregations or other calculations optimized for RDLC or Word layout and they’re not the best option for Excel layouts. The same is for documents.
To start working with Excel layouts, start your report and select the Schedule button. From here, select the Microsoft Excel Document (data only) option:

This option will download an Excel file that contains the dataset of your report (data contract). In this Excel file you have two worksheets: Data (that contains captions and record values for your dataset) and Report Metadata (contains filters and report properties).
To work with Excel layouts, it’s important to know that the Data worksheet is the basis of your layout. Don’t do modifications of its structure and don’t rename the fields or change the tables on it.
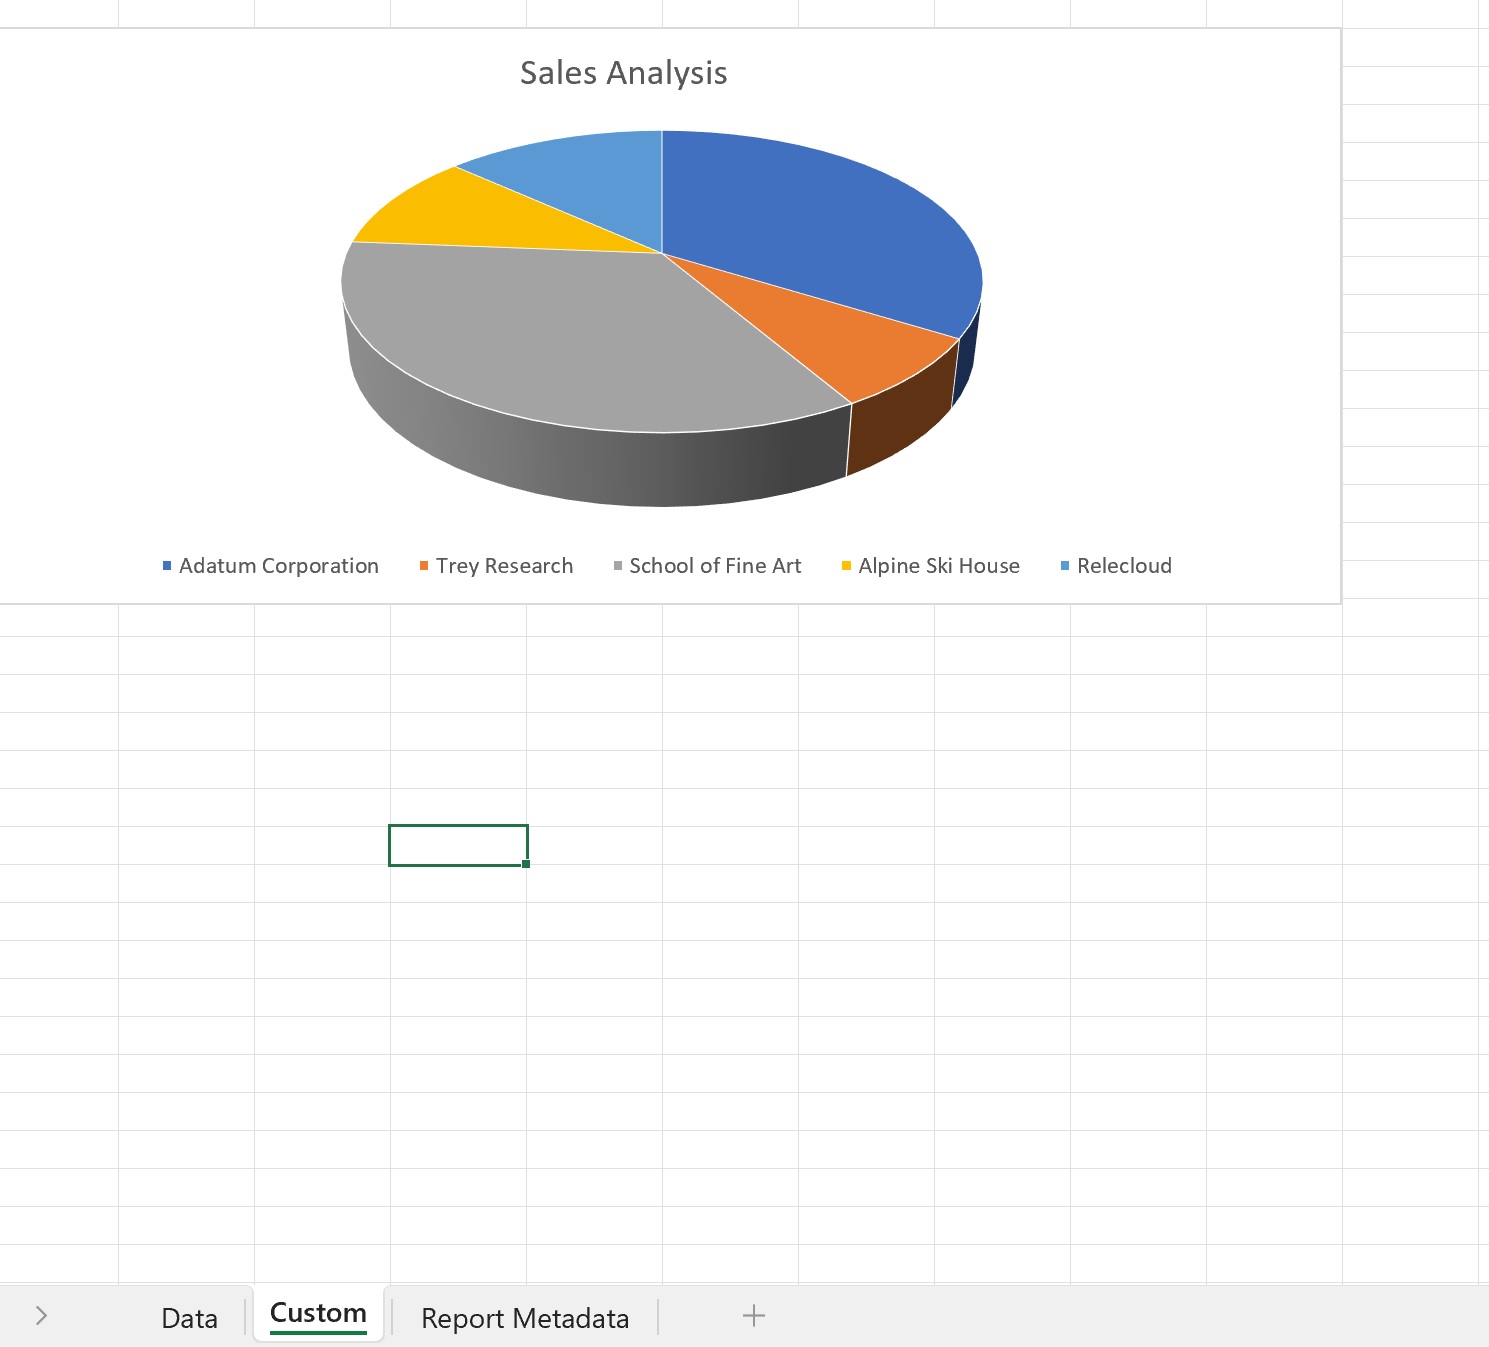
For this sample, I’ve added to the downloaded Excel sheet a new worksheet (here called Custom) and on this new worksheet I define my custom report layout:

In this new worksheet you can use all the available Excel features for creating a report starting from the Data worksheet. You can use charts, formulas, fonts, formatting, adding images, using PowerQuery and more. For simplicity, I’ve added a chart of the sales per customer by creating a new chart using the Customer_Name and AmtSalesLCY data columns.
When the worksheet model is ready, open the Report Layouts page, select your report (here report id = 119) and click on New Layout.
Here you can select the type of layout to add and its properties. Select Format Options = Excel and give a name for your newly created Excel layout:

Then click OK. The system now asks you to upload your Excel sheet where you have defined the layout and then the layout is imported as a custom layout for the selected report (layout type is Excel):

You can set this newly created Excel layout as default for your report by clicking on the Set Default button:

Now that the Excel layout is imported, let’s try to execute the Customer – Sales List report again. This report now has an Excel layout as default, so a Download button appears:

When you click on it, the report is downloaded to the user’s machine and the layout is magically filled automatically:
Do you think that is cool? I think so… with this new layout type, lots of customer’s requests to have data extractions for creating Excel reports or to have Excel reports automatically generated from Business Central can be satisfied without doing nothing. Your customer has now all the freedom to create its own reports or dashboards for its data analysis needs.
Obviously, one personal recommendation: Excel layouts are extremely powerful for reports where the dataset contains the entire data, not for reports where you have previously aggregated data via AL code. If customers asks you to have data analysis reports for sales, purchases, jobs, financials and more, now you can create a report in AL that shows the rough data (for example, list of sales lines, list of purchase lines, list of G/L entries, list of Job Ledger Entries) and the customer can perform its own custom calculations or aggregations via Excel, save the template as a new Excel layout, upload it and that’s done! Every time he runs the report, the calculations will be automatically performed.
A last note: at the time of writing this post, Excel layouts do not support translations. Field names in the Excel data worksheet are the AL field names (a defined in the table or in the dataset) and you cannot change them.
Please give it a try… I think you can save a lot of hours working on reporting in V20 😉
P.S. Kudos to Kennie Nybo Pontoppidan, the mind under this new great feature.

This is cool! Customers will love this new feature. Thank you Stefano for sharing this!
Regards,
[cid:image001.jpg@01D8320F.07C07020]
[cid:image002.jpg@01D8320F.07C07020]
Ruel Enconado
Business Development Manager, CoreBiz AsiaPacific
Phone: 632-8540-2200
Mobile: 0925-7031524
Email:
ruel.enconado@corebiz.com.au
http://www.corebiz.com.au
[Title: LinkedIn – Description: image of LinkedIn icon]
LikeLike