

During the last week’s Microsoft WE Dynamics 365 Business Central telemetry webcast (day 2 of a 3 part serie) I provided some small “hidden tips” on using Application Insights and some of them was borned after requests from partners.
One of the common request received (also after our session at last Directions EMEA) was how to perform telemetry queries cross Application Insights instances.
A common partner question that I always receive is: should I use a single Application Insight instance or N instances for monitoring my customers or apps?
In my opinion there’s no a unique answer to this question, mainly because partitioning of Application Insights resources across multiple customers or apps depends on the goal of your telemetry analysis. Personally I prefer a 1:1 relationship between customers/apps and Application Insights resources and the main benefits of this setup are:
- Easy monitoring of a single Dynamics 365 Business central tenant.
- Easy to separate the cost of telemetry per customer/app.
- Possibility to use the Usage features in the Application Insights portal to monitor how a particular customer is using the ERP.
but this is up to you.
When you have multiple Application Insights instances in place, sometimes you can have the need to perform KQL queries on both instances together in order to see the aggregate data (imagine that you’re monitoring N customers or N apps).
How can you do that?
This is where the concept of workspaces comes in handy.
Workspace-based resources support full integration between Application Insights and Log Analytics. You can now choose to send your Application Insights telemetry to a common Log Analytics workspace, which allows you full access to all the features of Log Analytics while keeping application, infrastructure, and platform logs in a single consolidated location.
When you create an Application Insights instance, in the instance details you can now specify a workspace:

and when the instance is created, in the Overview pane of your Application Insights instance you have the corresponding workspace informations:
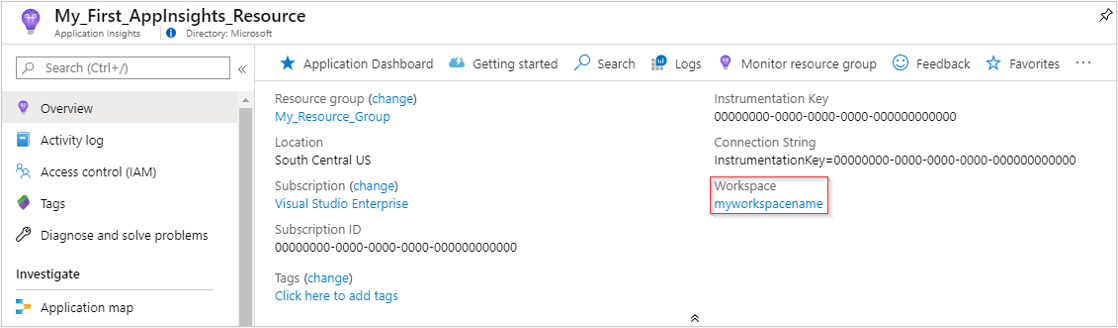
Clicking on the workspace name will take you to the associated Log Analytics workspace.
NOTE: Please remember that classic Application Insights will be retired on in February 2024 and using Workspace-based Application Insights is the way forward.
You can easily migrate a Classic Application Insights resource to a workspace-based resource. From your Application Insights resource, select Properties under the Configure heading in the left-hand menu bar and then select the Migrate to Workspace-based option:

You can now select the Log Analytics Workspace where you want all future ingested Application Insights telemetry to be stored and once your resource is migrated, you will see the corresponding workspace info in the Overview pane as usual.
Saying that, how we can use workspaces for performing cross-instances Application Insights queries?
Imagine that we have have the following situation:
- Application Insights instance 1 connected to Production1
- Application Insights instance 2 connected to Production2

These Dynamics 365 Business Central environments can be on the same tenant or on different tenants (different customers) or they can also be two different instances that monitors two different ISV apps.
If we have a single Application Insights instance, we can see the entire list of traces injected by Dynamics 365 Business Central in a selected period using Log Analitics with the following KQL query:
traces

But if we want to see the list of traces injected by Dynamics 365 Business Central on the two Production environments?
As a first step, retrieve the Workspace ID of each Application Insights instances associated workspaces:

Then you can join the query between workspaces in the following way:
union
workspace('WORKSPACEID1').AppTraces,
workspace('WORKSPACEID2').AppTraces
If you execute the above query, the output is the entire Dynamics 365 Business Central traces on both environments (Production1 and Production2) in the selected period:

You can also render aggregated pie charts:

that you can pin to your dashboards to have immediate aggregated views.
And if you want to perform more complex KQL queries?
Let’s take as an example the following KQL query that gives you the long running AL methods details (standard query provided by Microsoft):
// Long running AL (RAW data)
traces
Let's
| where timestamp > ago(60d) // adjust as needed
and customDimensions.eventId == 'RT0018'
and customDimensions.alObjectId > 0 // filter out internal server calls
| extend eventId = customDimensions.eventId
, aadID = customDimensions.aadTenantId
, environmentName = customDimensions.environmentName
, environmentType = customDimensions.environmentType
, companyName = customDimensions.companyName
, alMethod = customDimensions.alMethod
, alObjectId = customDimensions.alObjectId
, alObjectName = customDimensions.alObjectName
, alObjectType = customDimensions.alObjectType
, alStackTrace = customDimensions.alStackTrace
, clientType = customDimensions.clientType
, executionTime = customDimensions.executionTime
, executionTimeInMS = toreal(totimespan(customDimensions.executionTime))/10000 //the datatype for executionTime is timespan
, extensionId = customDimensions.extensionId
, extensionInfo = customDimensions.extensionInfo
, extensionName = customDimensions.extensionName
, extensionPublisher = customDimensions.extensionPublisher
, extensionVersion = customDimensions.extensionVersion
, longRunningThreshold = customDimensions.longRunningThreshold
, longRunningThresholdInMS = toreal(totimespan(customDimensions.longRunningThreshold))/10000 //the datatype for executionTime is timespan
How can we execute the same KQL query across Application Insights instances?
Just modify the query as follows:
union
workspace('9838b0a6-57b4-4606-a909-6027e31c1ce0').AppTraces,
workspace('99b43dc2-4aae-4b08-9bc2-0e883b32b4cf').AppTraces
| where TimeGenerated > ago(60d) // adjust as needed
and Properties.eventId == 'RT0018'
and Properties.alObjectId > 0 // filter out internal server calls
| extend eventId = Properties.eventId
, aadID = Properties.aadTenantId
, environmentName = Properties.environmentName
, environmentType = Properties.environmentType
, companyName = Properties.companyName
, alMethod = Properties.alMethod
, alObjectId = Properties.alObjectId
, alObjectName = Properties.alObjectName
, alObjectType = Properties.alObjectType
, alStackTrace = Properties.alStackTrace
, clientType = Properties.clientType
, executionTime = Properties.executionTime
, executionTimeInMS = toreal(totimespan(Properties.executionTime))/10000 //the datatype for executionTime is timespan
, extensionId = Properties.extensionId
, extensionInfo = Properties.extensionInfo
, extensionName = Properties.extensionName
, extensionPublisher = Properties.extensionPublisher
, extensionVersion = Properties.extensionVersion
, longRunningThreshold = Properties.longRunningThreshold
, longRunningThresholdInMS = toreal(totimespan(Properties.longRunningThreshold))/10000
and here your aggregated results:

P.S. intellisense is not always helping you 🙂
I think this is a quite useful way of monitoring multiple Dynamics 365 Business Central instances together and lots of interesting informations can be extracted by performing reports that aggregate informations across instances.
If you have these needs, give it a try…
