

Yesterday I saw a Twitter thread asking for suggestions about tools for load testing APIs. There are lots of tools for doing load testing for web services and APIs (commercial tools, open source tools, “do it yourself” tools like Powershell, custom programs and so on) but that tweet was the reason that prompted me to write this post.
One of my preferred tool for doing load testing with Web Servics and APIs is Apache JMeter. Despite this tool is written in Java (yes, I don’t like Java apps, sorry…), JMeter is a an open source software designed to load test functional behavior and measure performance of web apploications and web services in general. Apache JMeter may be used to test performance both on static and dynamic resources and web applications.
It can be used to simulate a heavy load on a server, group of servers, network or object to test its strength or to analyze overall performance under different load types.
Why not using Apache JMeter to load test Dynamics 365 Business Central APIs? 🙂
To start using JMeter, you need to install the Java Runtime on your machine (Java Runtime 8 is required for the latest version). After that, simply download the JMeter package and unzip it on a folder on your machine. You will have a directory structure like the following:
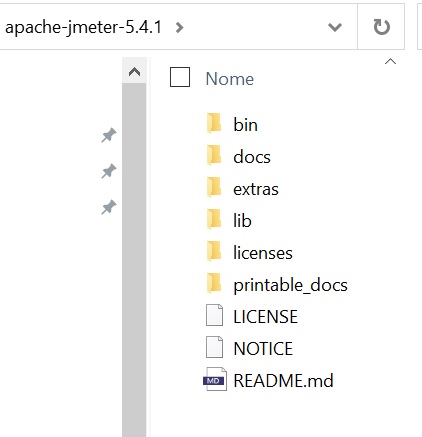
Inside the BIN folder, there’s a .bat file called jmeter.bat. Simply start this file and the JMeter GUI will start.
Please remember that using the GUI interface is not recommended to execute load testing in real production scenarios. The GUI should be used for testing, then JMeter has a command line interface to start the created test via scripts. Here, I will use the GUI interface.
To start creating a load test, you need to create a Test Plan. A Test Plan is a container for running tests and it defines what must be tested and how. Here, I’ve called my test plan D365BC API Test Plan:

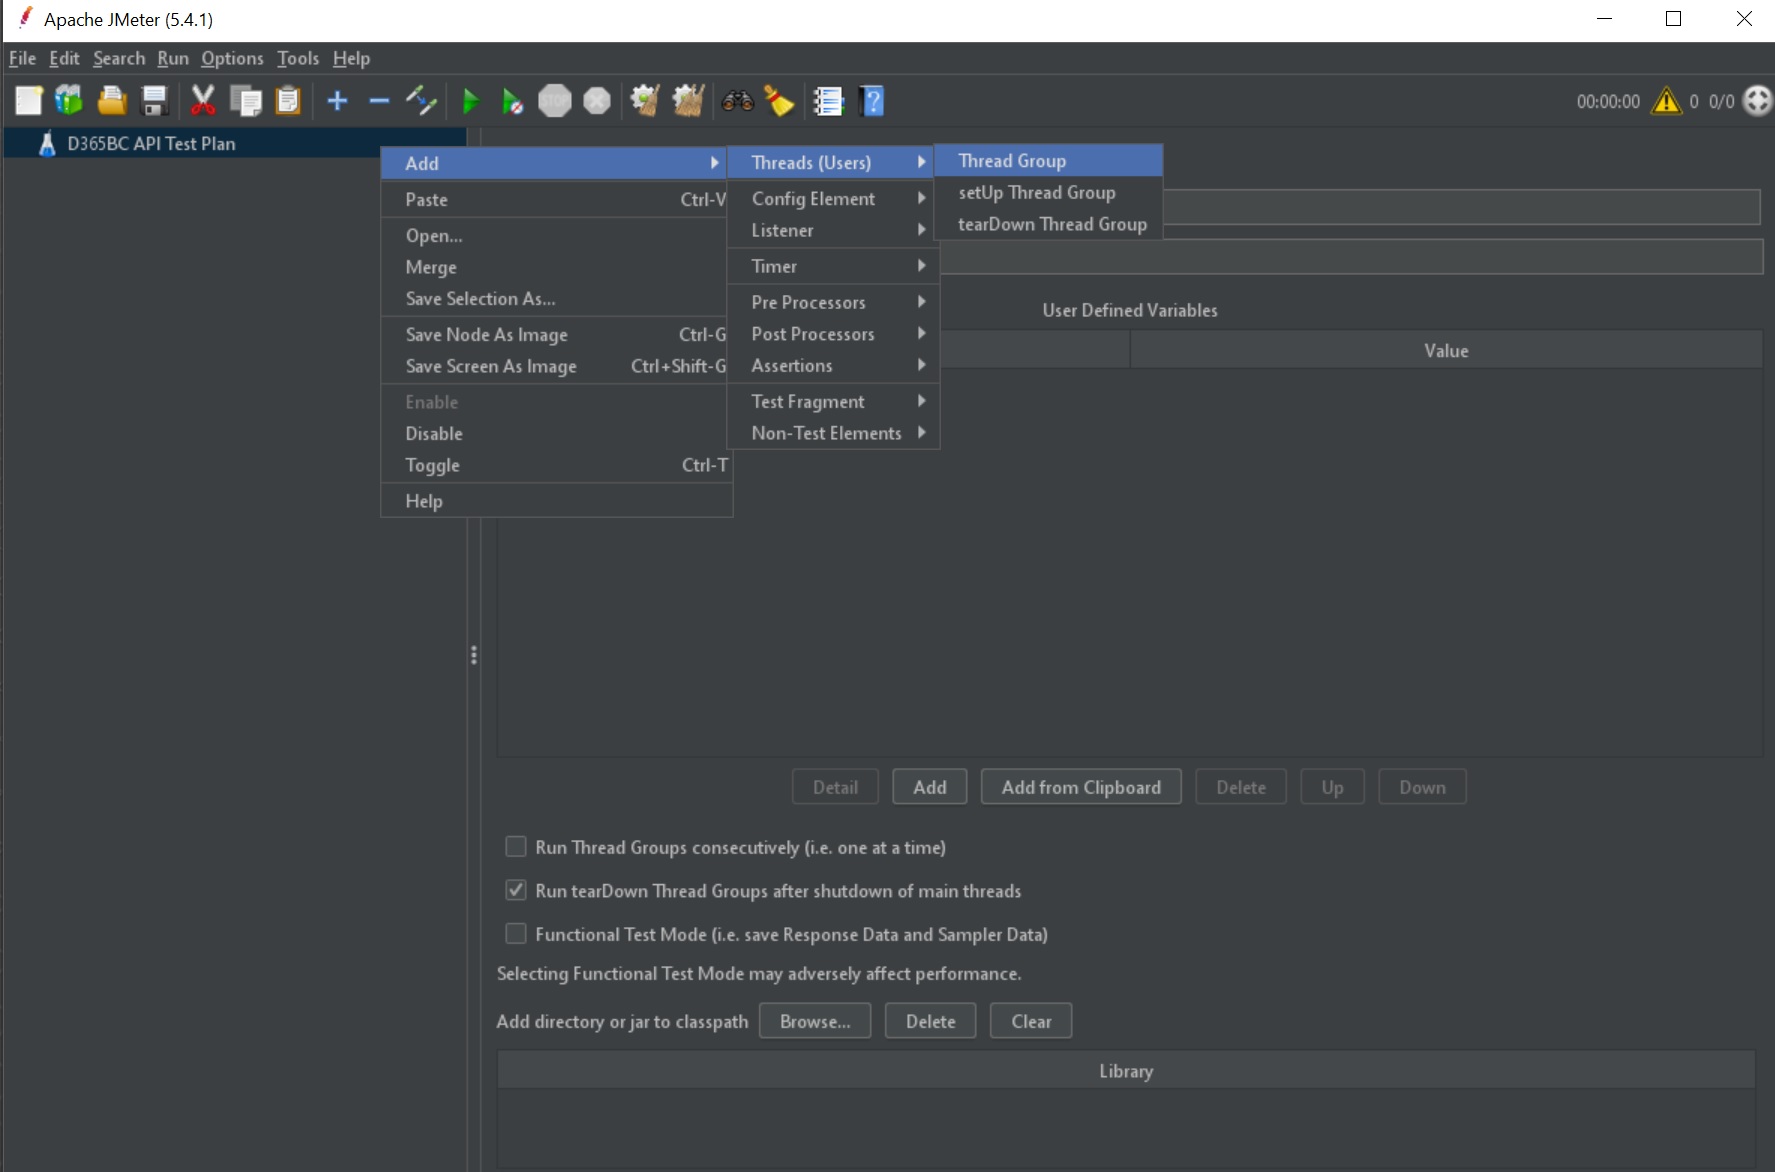
When the Test Plan is created, we need to configure it. We need to have at least one Thread Group for the test plan in order to run the load test. Right-click on the Test Plan and select Add|Threads (Users)|Thread Group:
A Thread Group is added to the Test Plan:
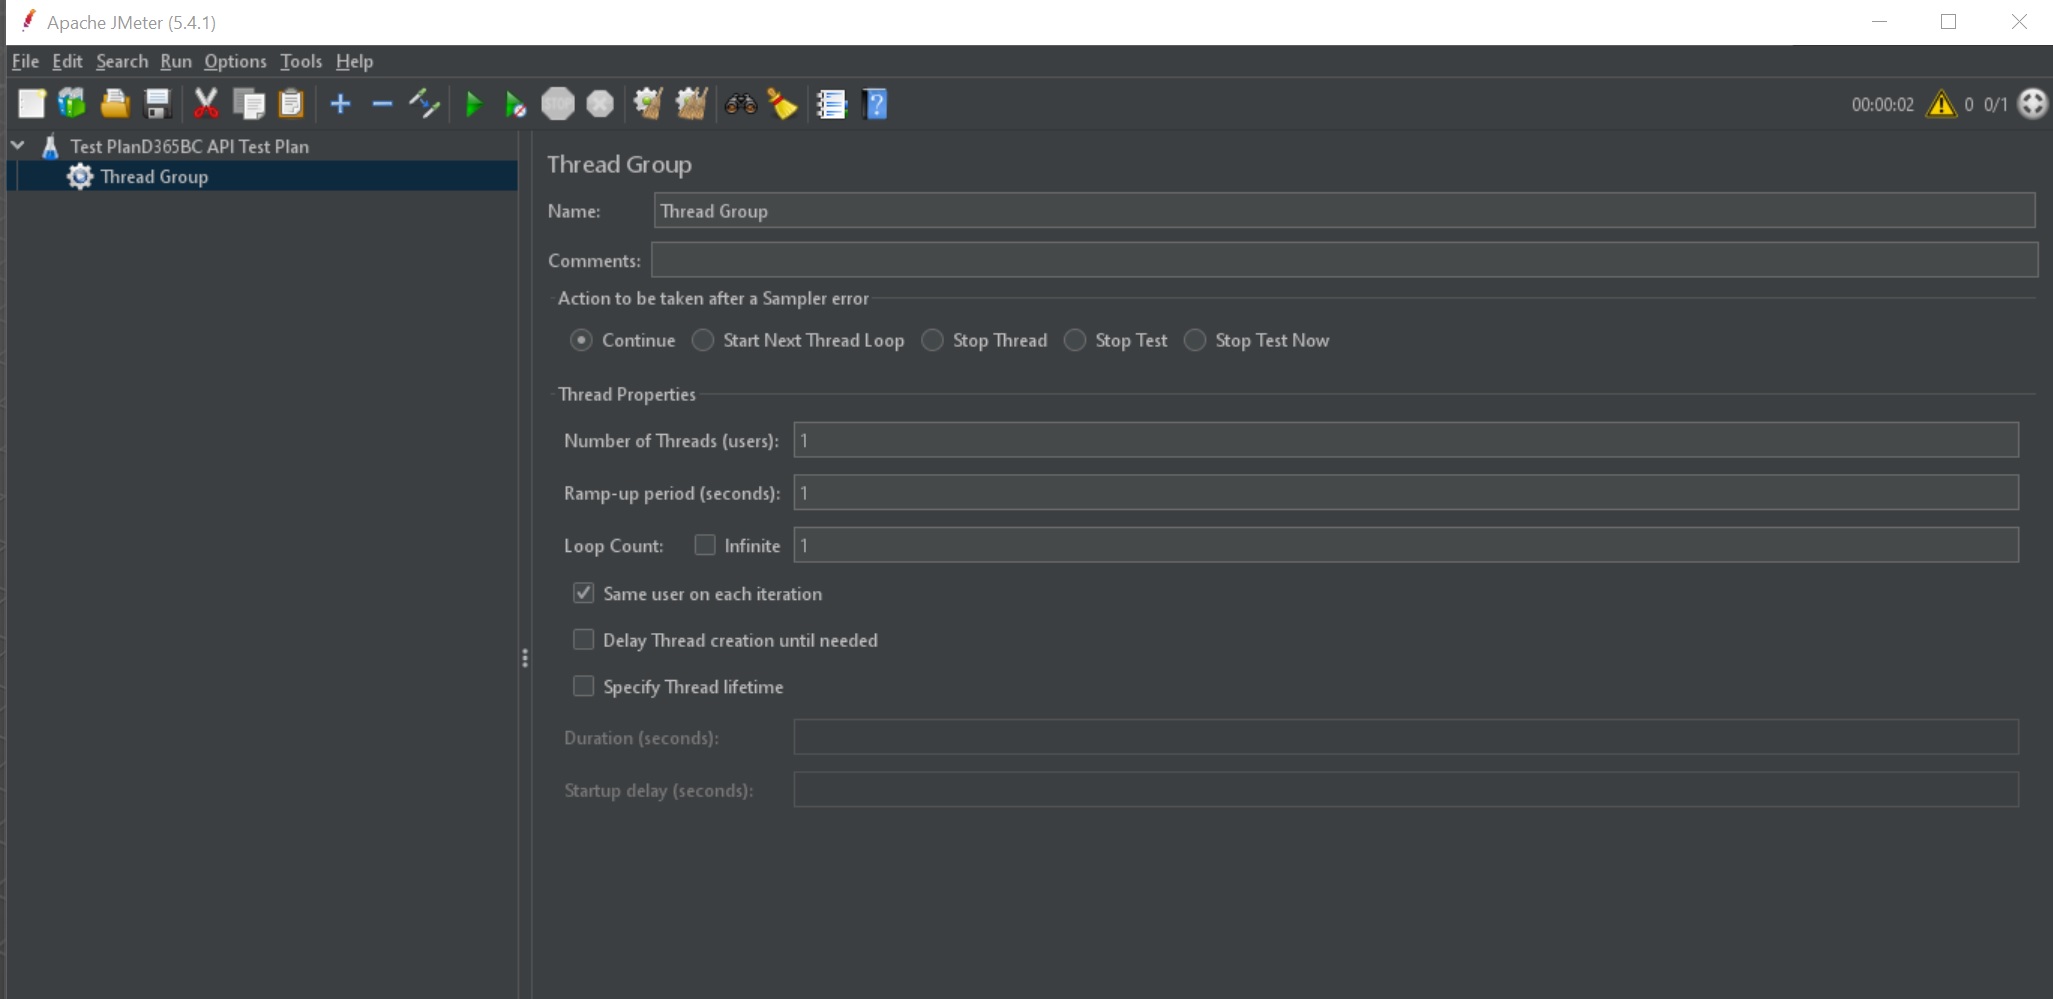
For the moment, we can leave the default values (1 user and 1 request). We’ll see later how to change these parameters and what they are.
For our load testing I will use the /Customers API on my Dynamics 365 Business Central sandbox environment. We will use Basic Authentication. The API responds to the following endpoint:
https://api.businesscentral.dynamics.com/v2.0/TENANTID/ENVIRONMENTNAME/api/v2.0/companies(COMPANYID)/customers
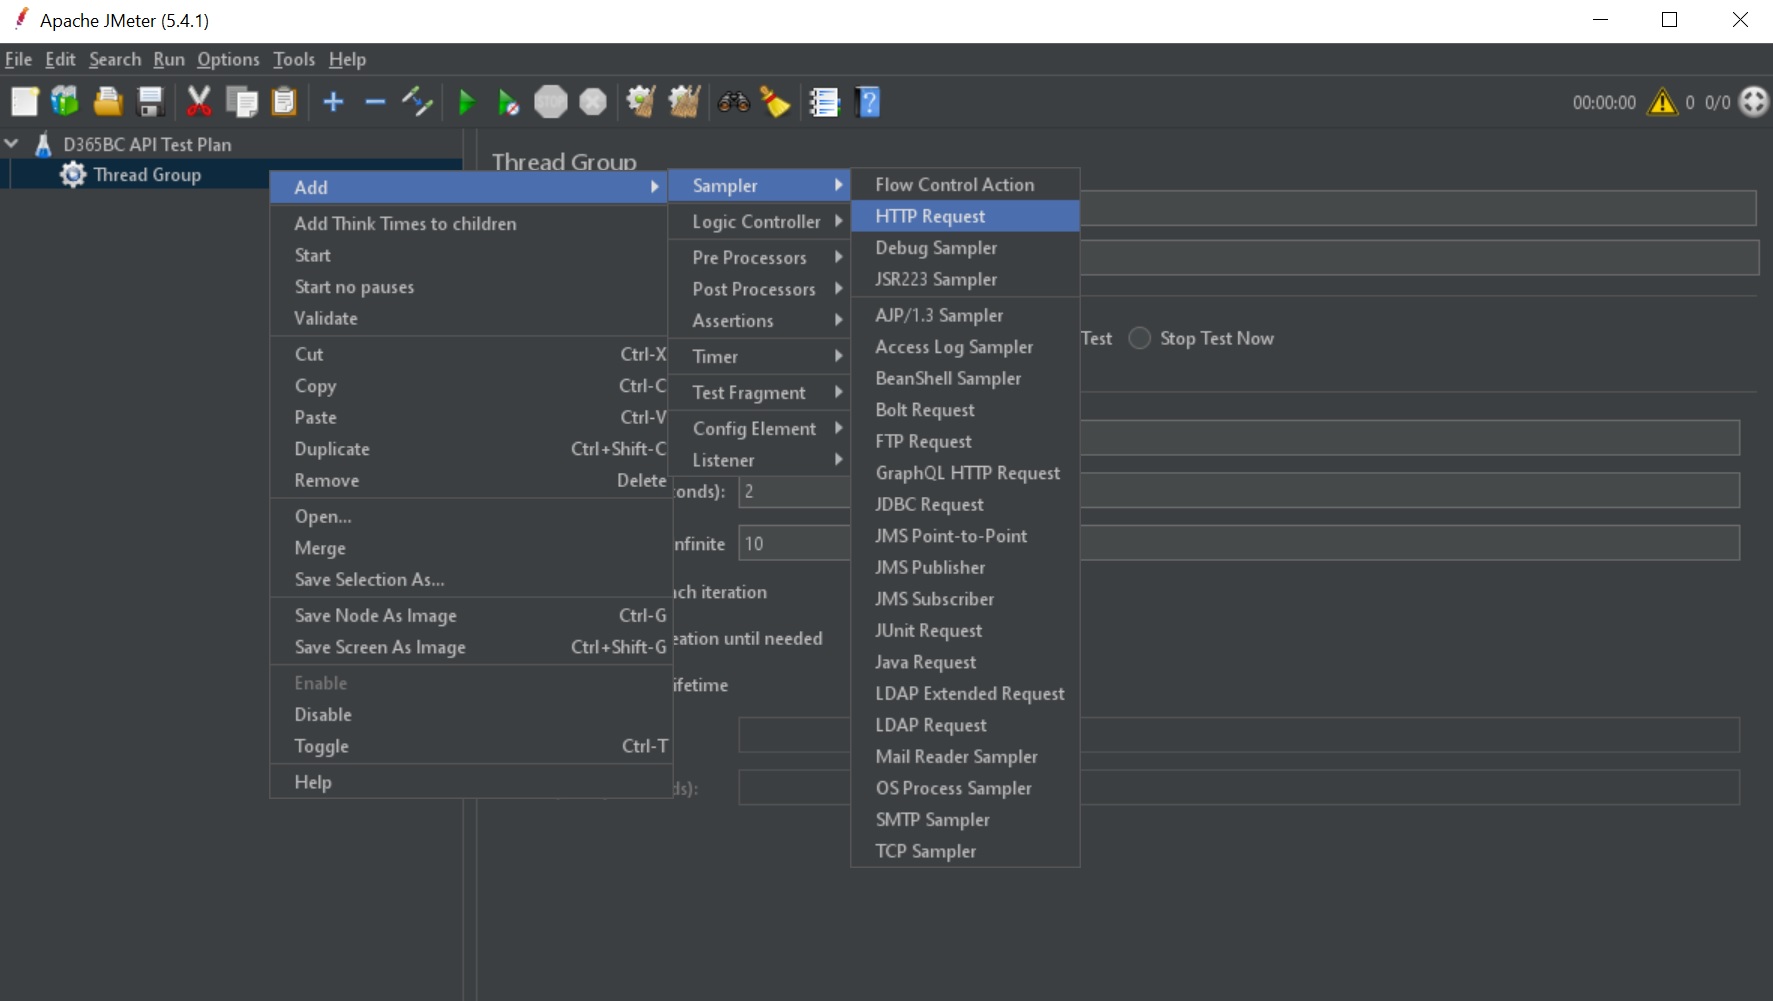
To handle the API request, right click the Thread Group and select Add|Sampler|HTTP Request:
The HTTP Request element is added and here is where you can configure your endpoint:
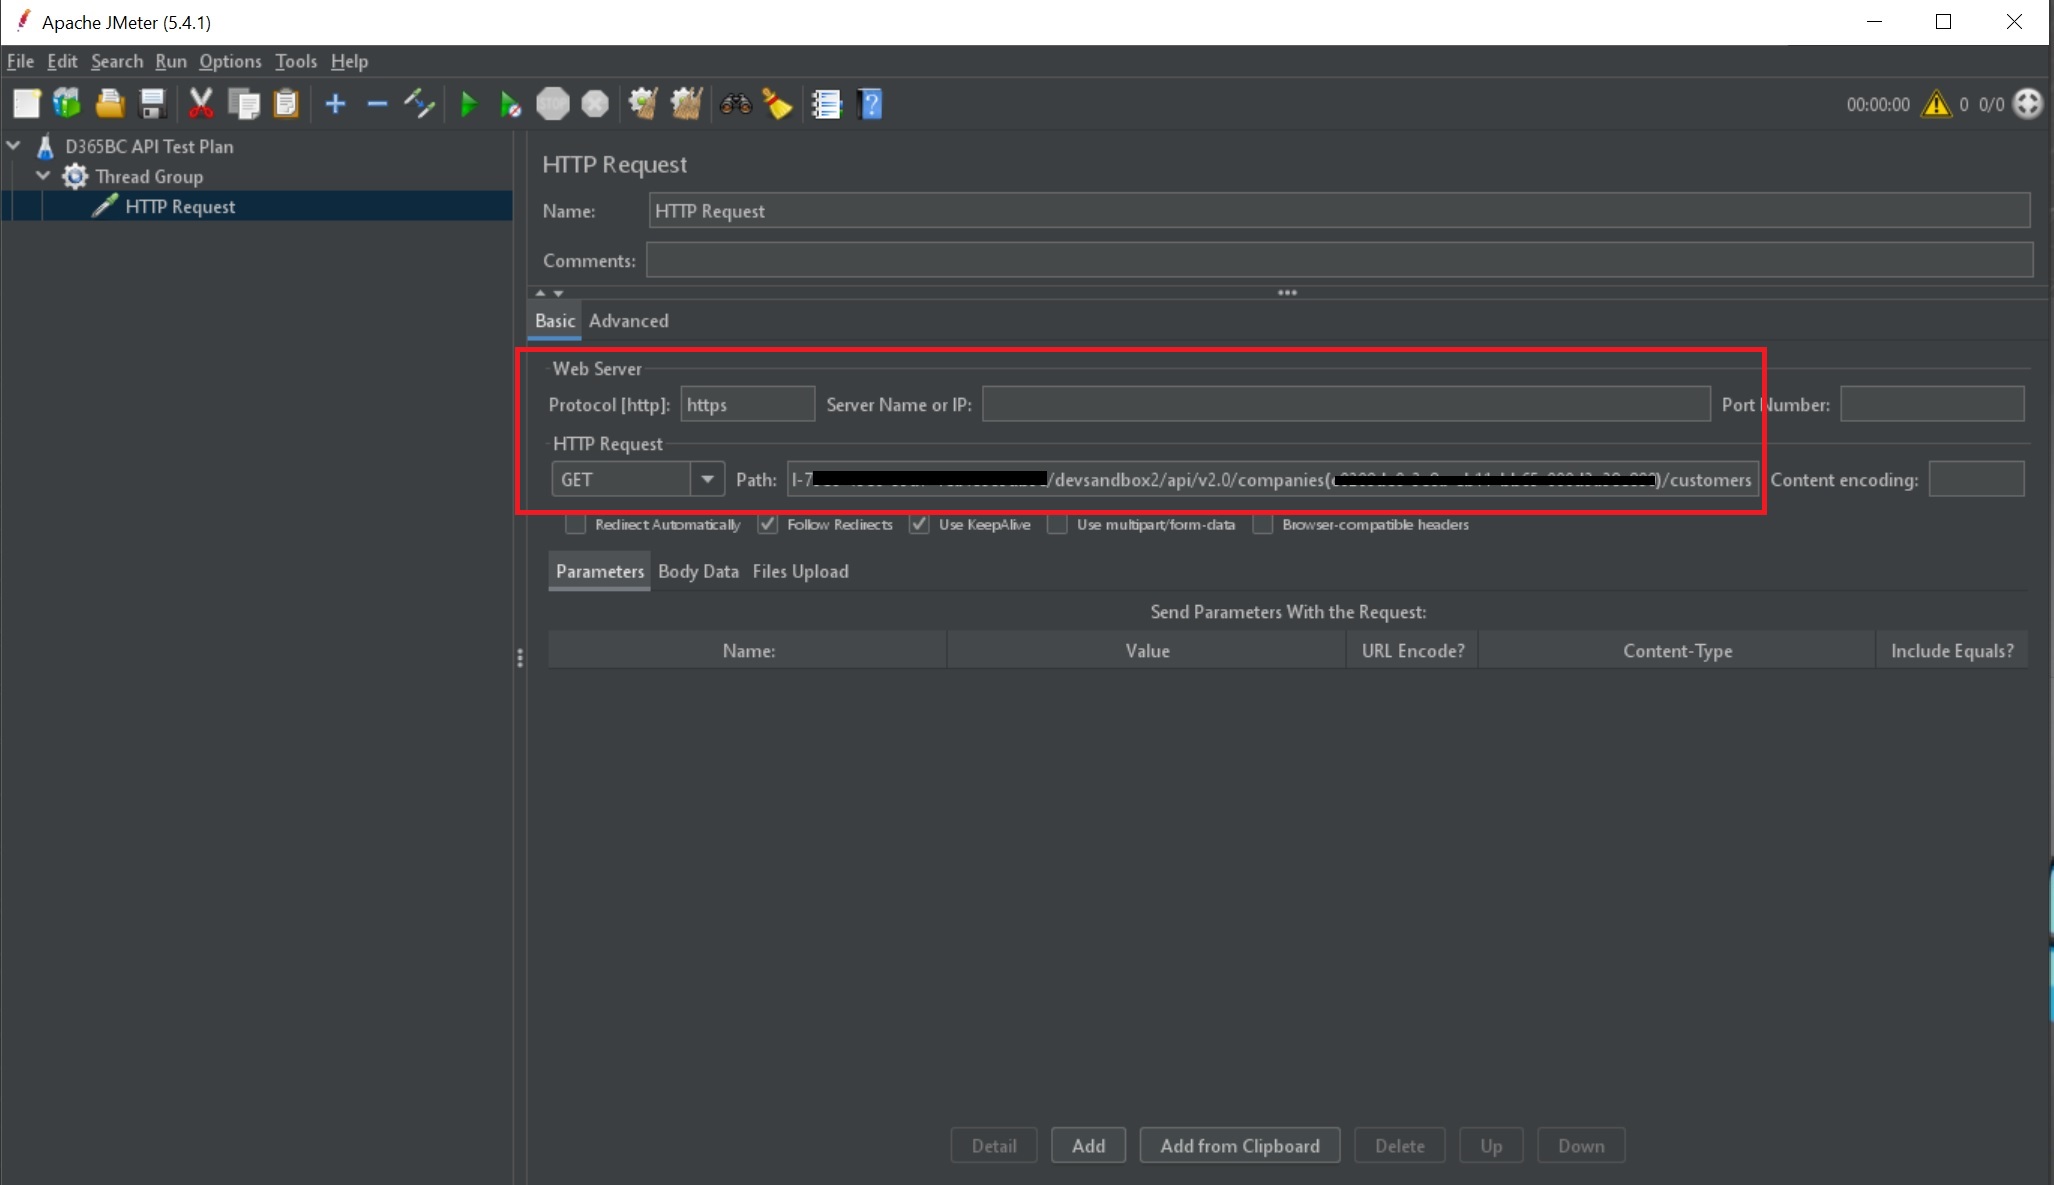
Set protocol as HTTPS, the HTTP method must be GET and the Path must be your API endpoint.
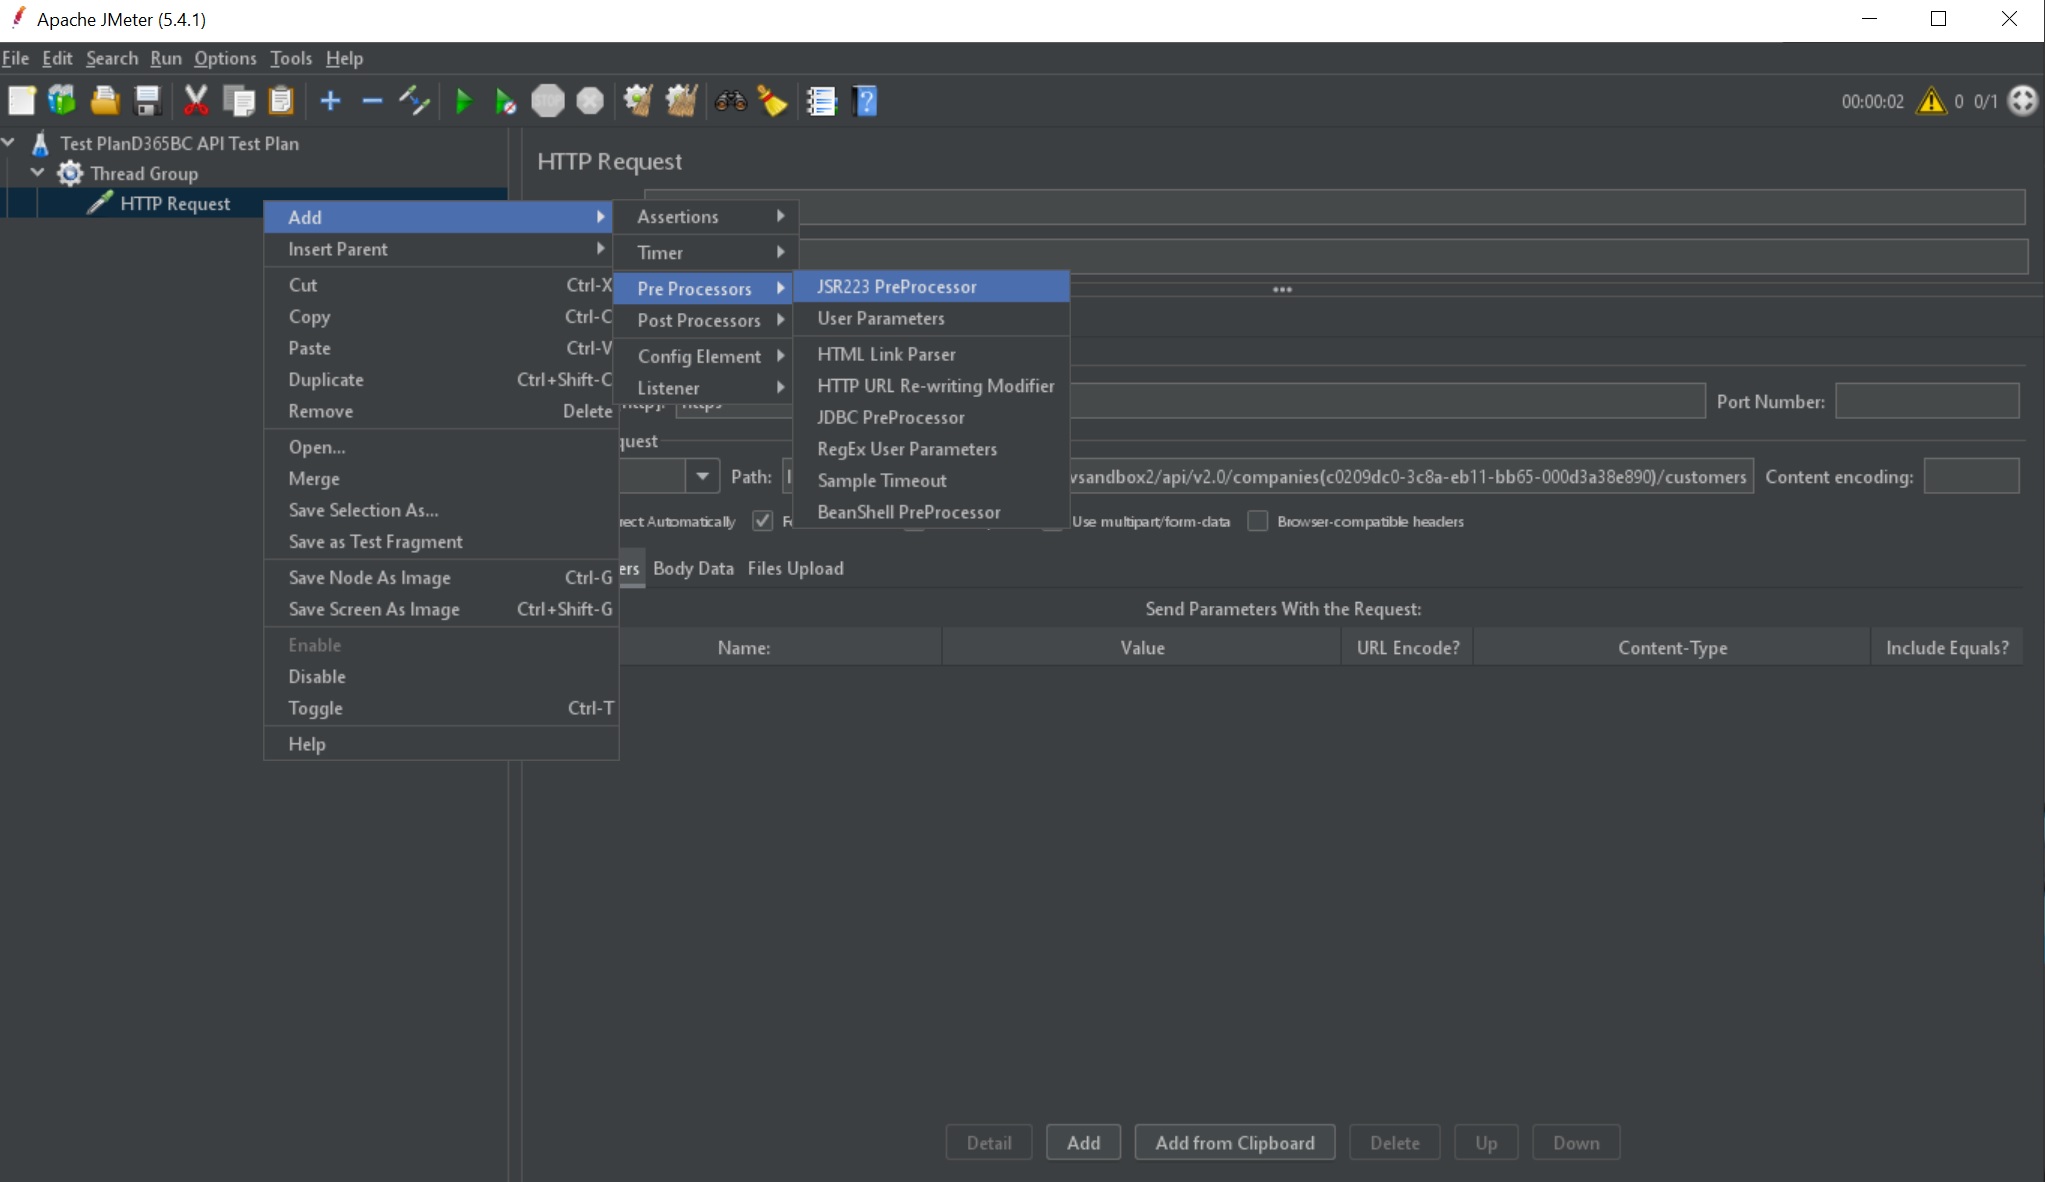
Then we need to specify the authentication, and this is maybe the most tricky part. We’re using Basic Authentication here, so we need to add in the request the Authorization header with the value Basic + the Base64 encoding of username and password. To do that in JMeter, we need to use the JSR223 Pre-Processor (JMeter doesn not have a native Base64 encoder out of the box). First, add the JSR223 PreProcessor:
and then you can use the following script to encode the username:password values (your Business Central user name and the web service access key):
import org.apache.commons.codec.binary.Base64;
byte[] encodedUsernamePassword = Base64.encodeBase64("YOURUSERNAME:YOURWSACCESSKEY".getBytes());
vars.put("auth",new String(encodedUsernamePassword));
Place the above script into the JSR223 PreProcessor window as follows:

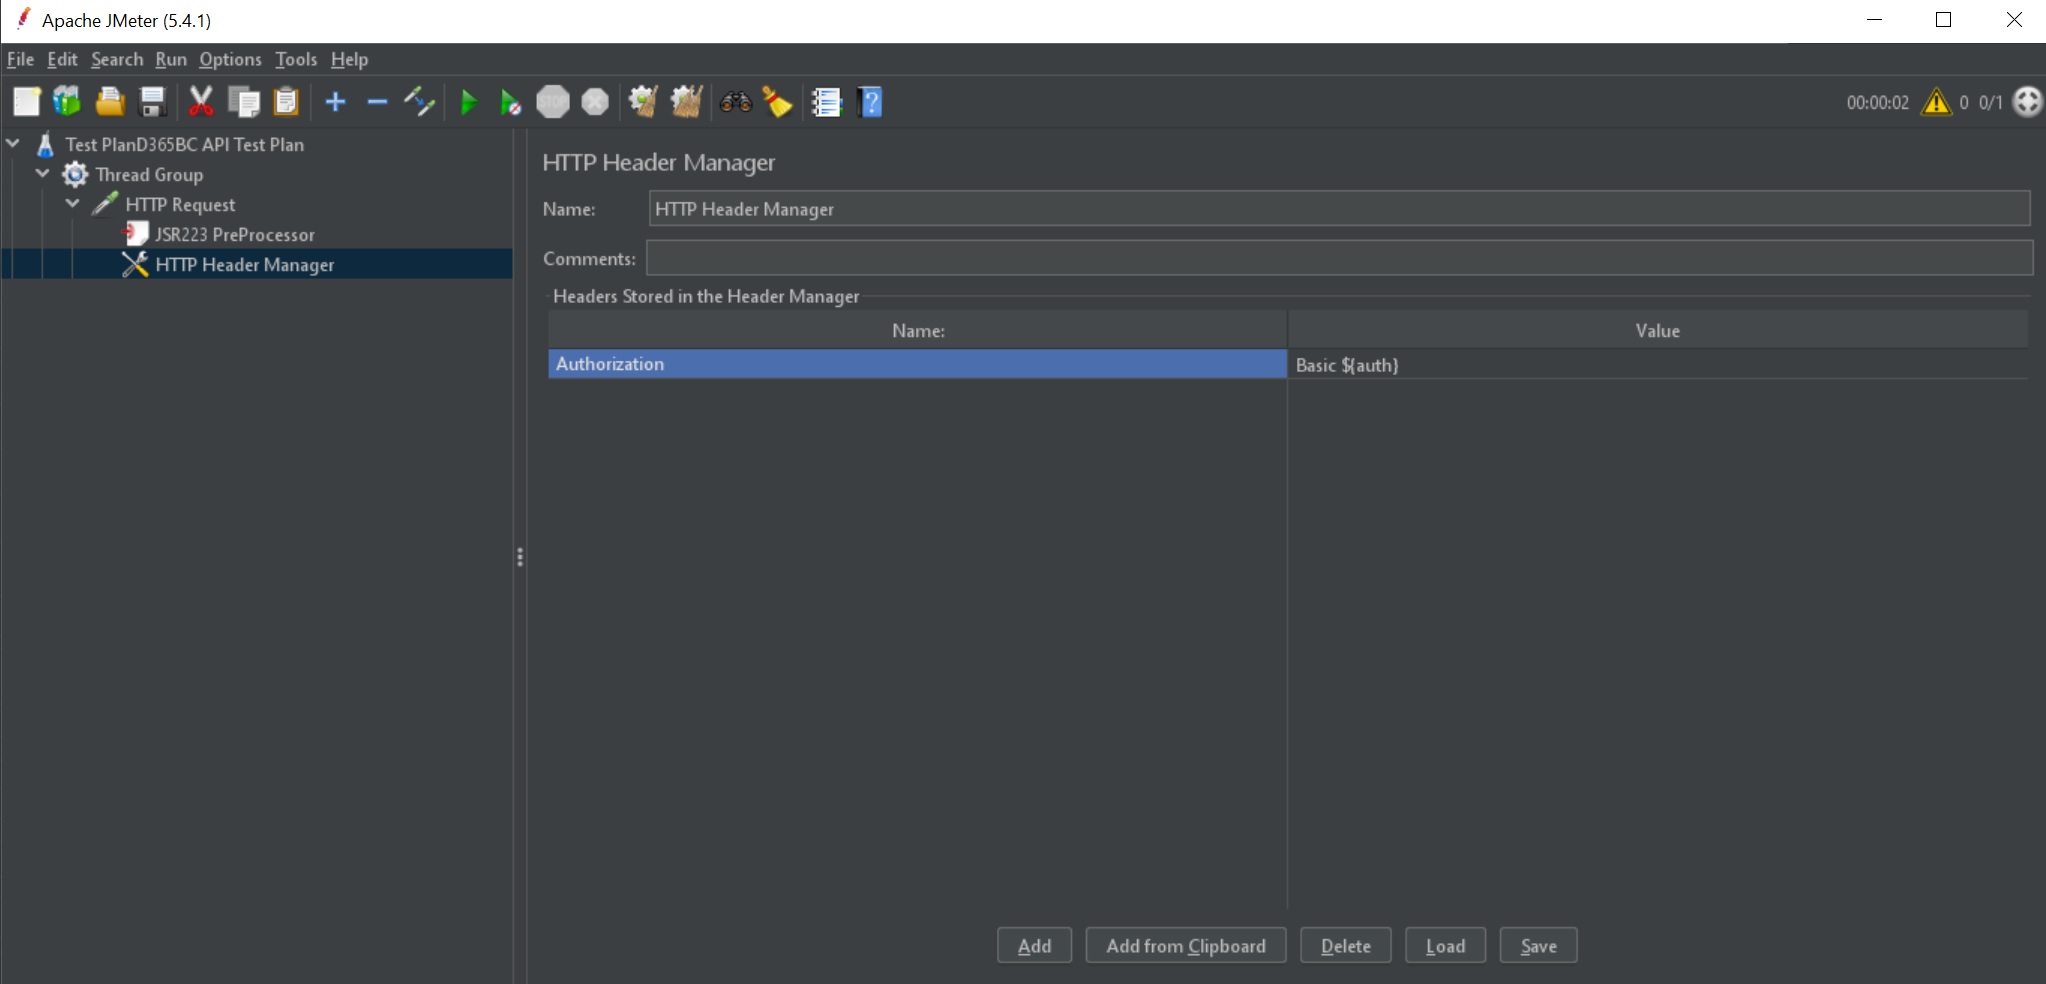
This script encodes our credentials and returns a Base64 value. We need to use this value into the request header and for this we need to add an HTTP Header Manager component. Right click the HTTP Request and select Add|Config Element|HTTP Header Manager:

Here, click on Add at the bottom of the page and add an element for the header with Name = Authorization and Value = Basic ${auth}:
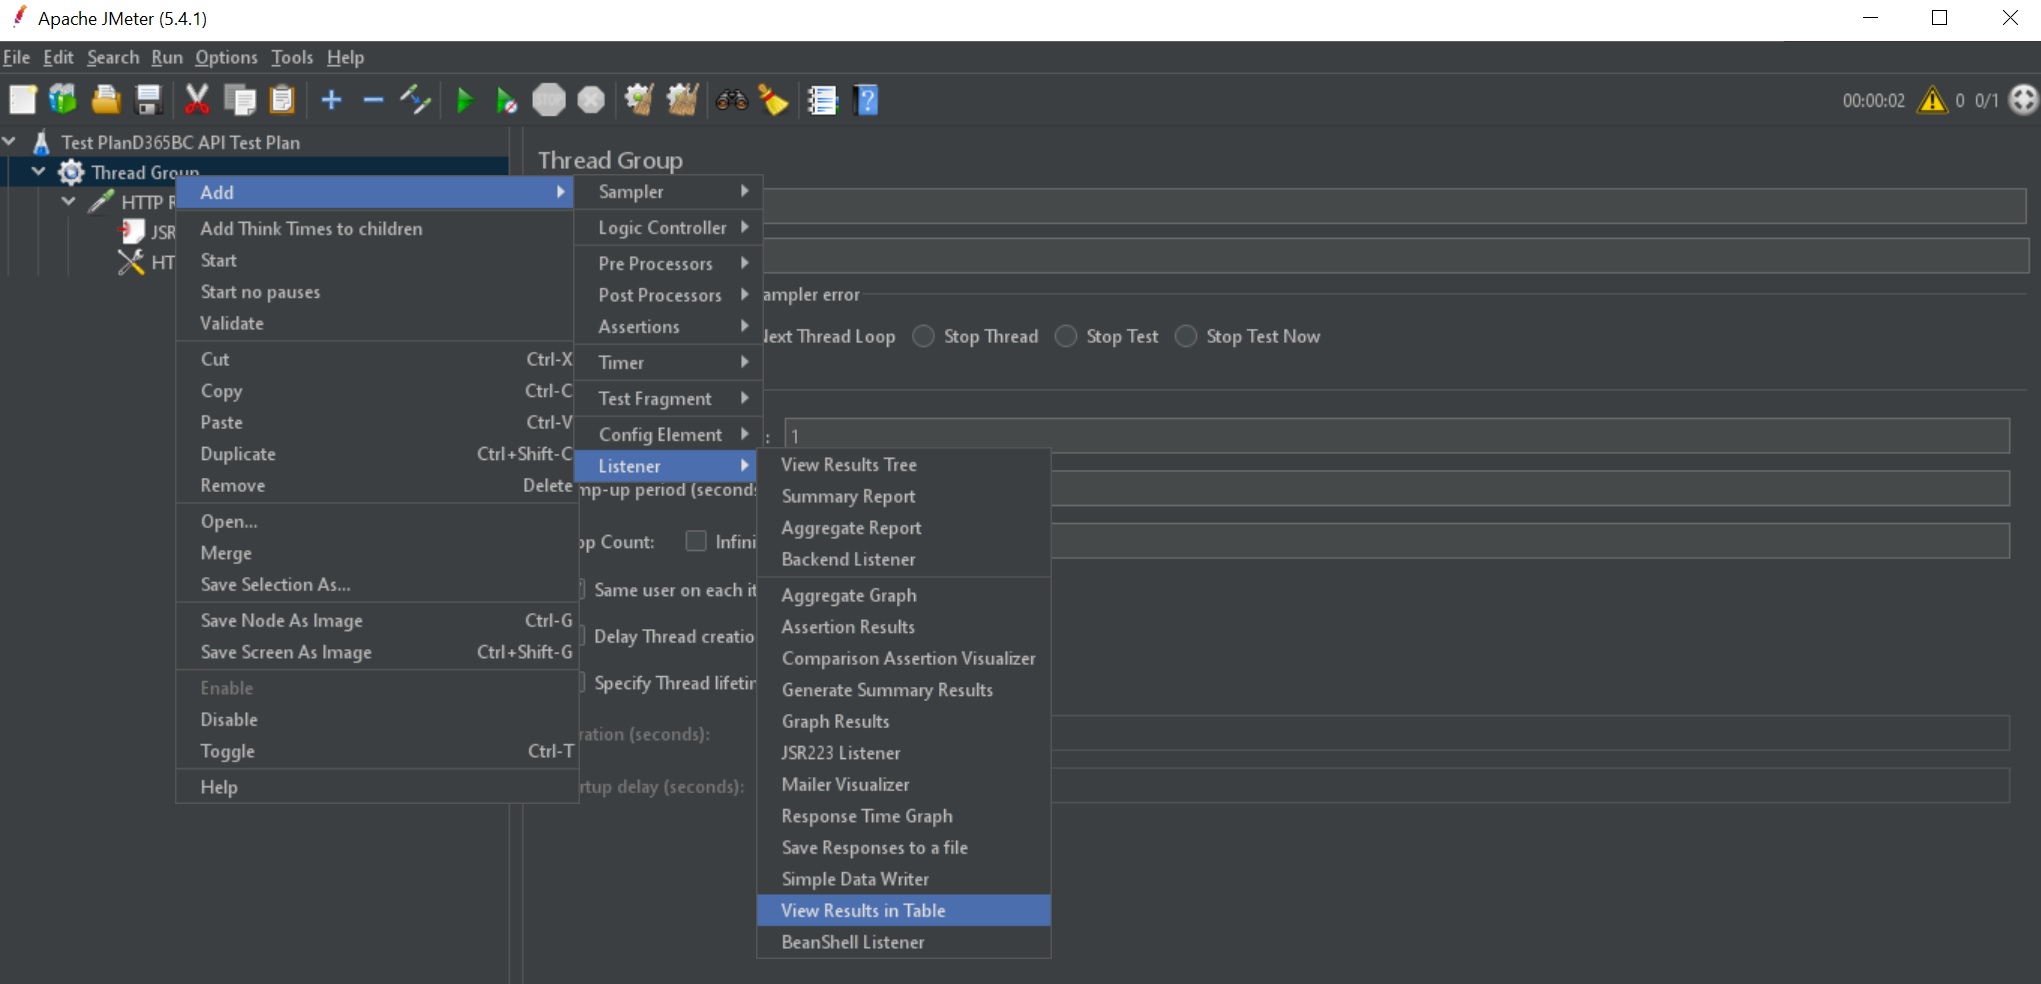
The HTTP request is now configured. To see the results of our test, we need to configure a Listener. Listeners are JMeter components used for managing the output of a load test. There are different types of listeners, but here right-click the Thread Group and select Add|Listeners|View Results in Table:
A Listener is added to the Test Plan. I’ve also added (with the same process previously described) a View Results Tree listener because it’s quite useful to see the details of the requests. Then, click the green arrow on the toolbar and if the test connects successfully to the API, you should see something like the following:
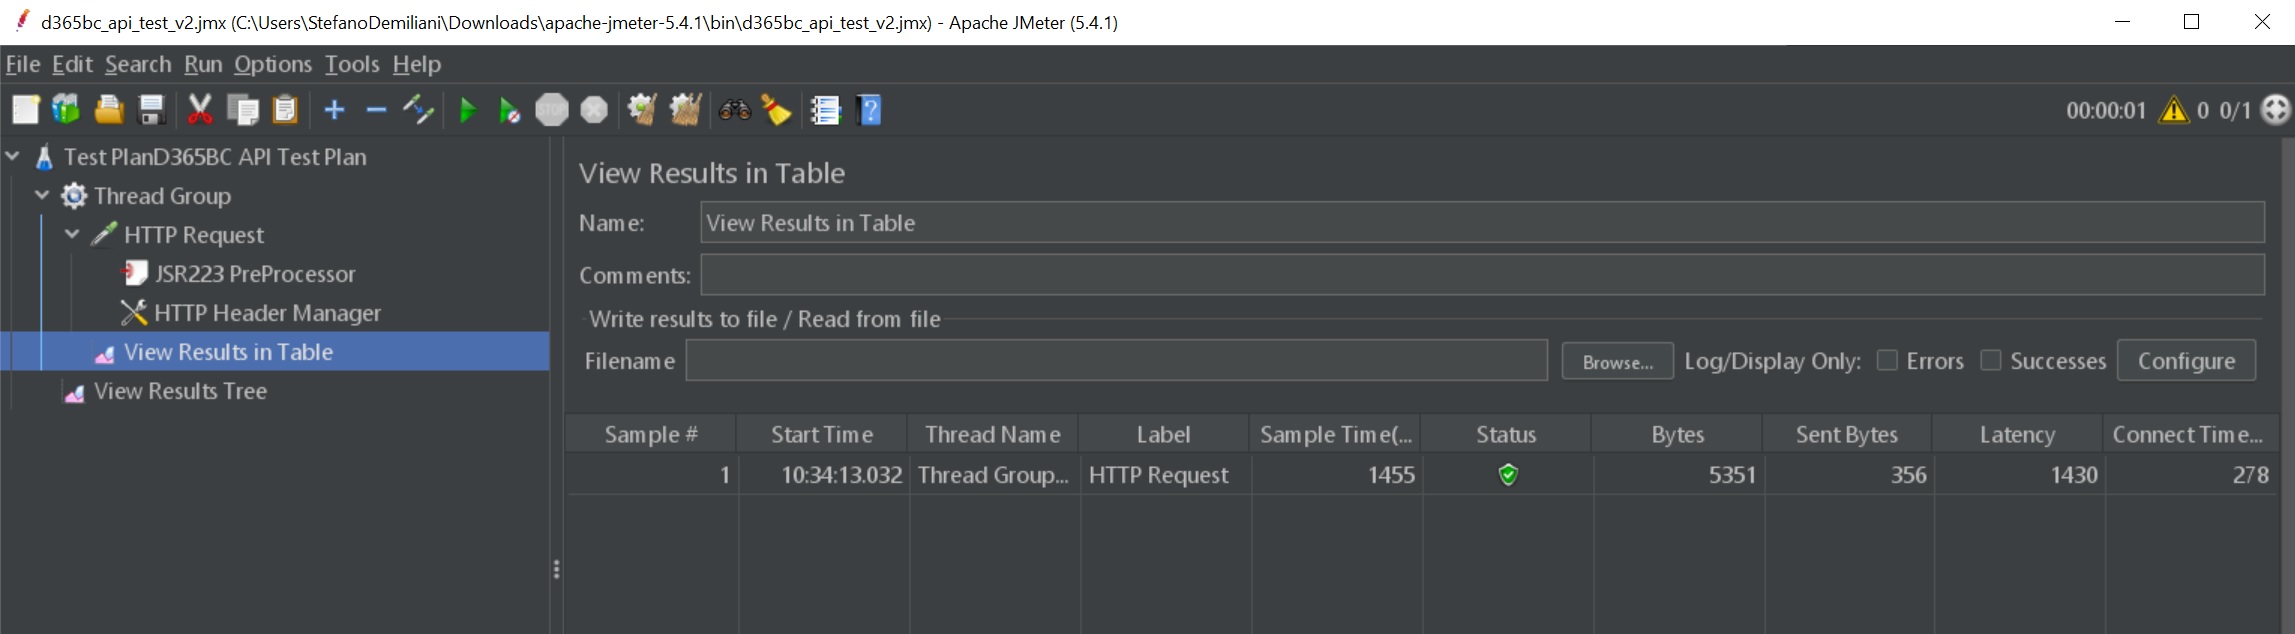
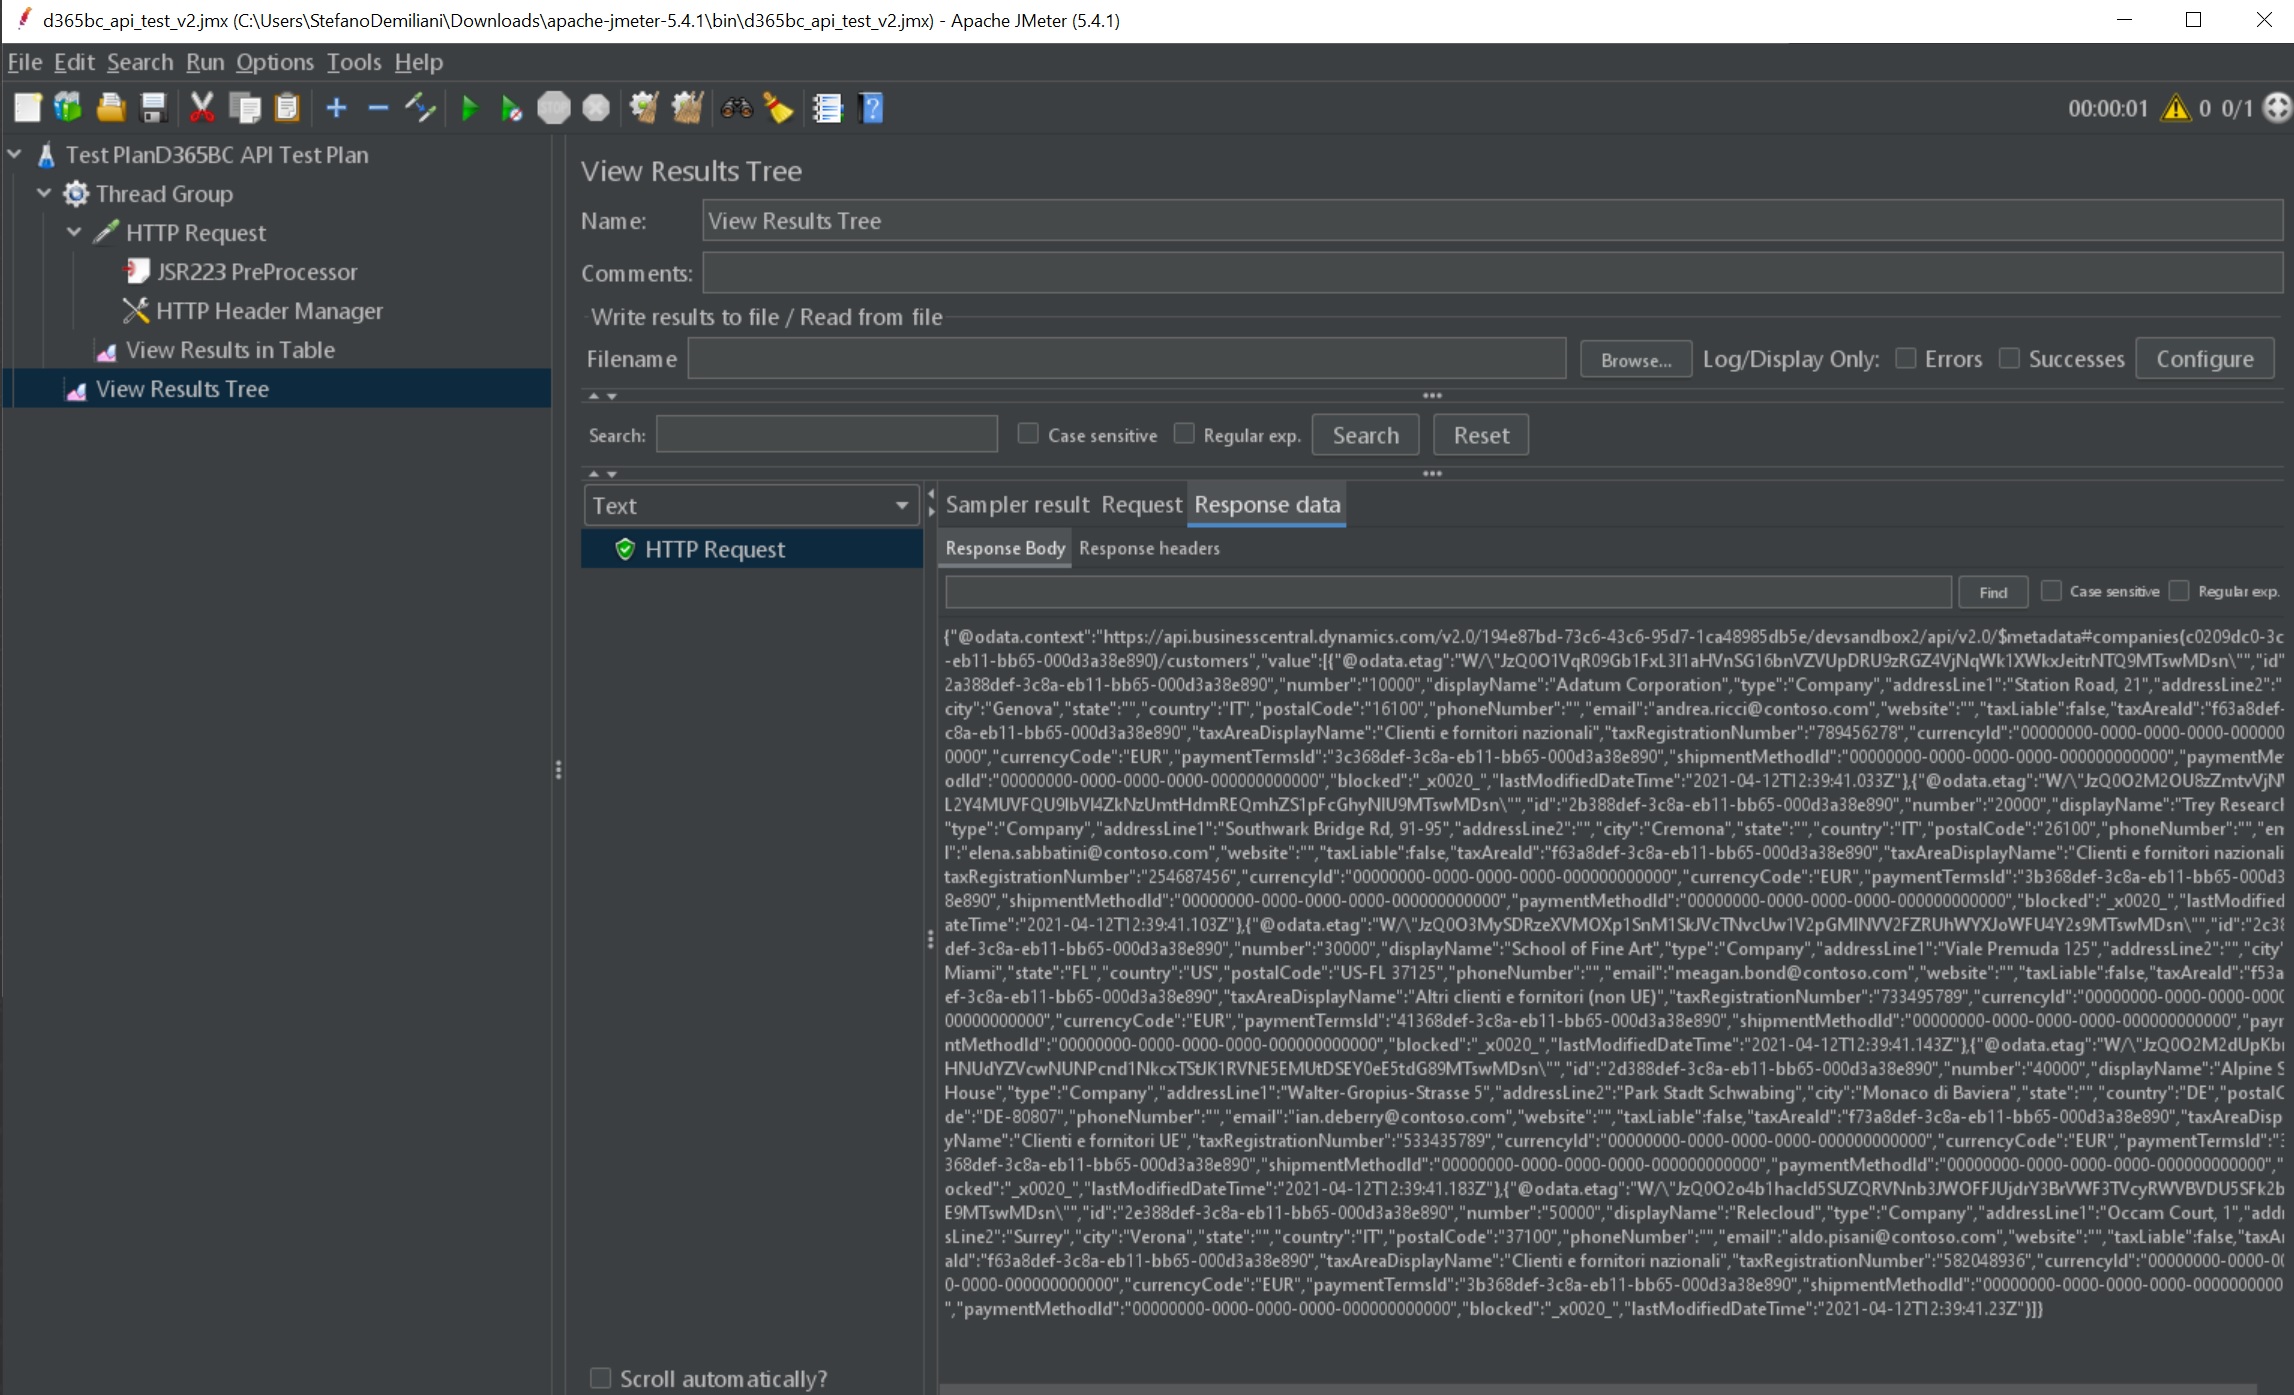
A request is successfully sent to our Dynamics 365 Business Central API. If you select the View Results in Tree listener you can see the request that was sent and you can inspect the details. Here for example, you can see the response:
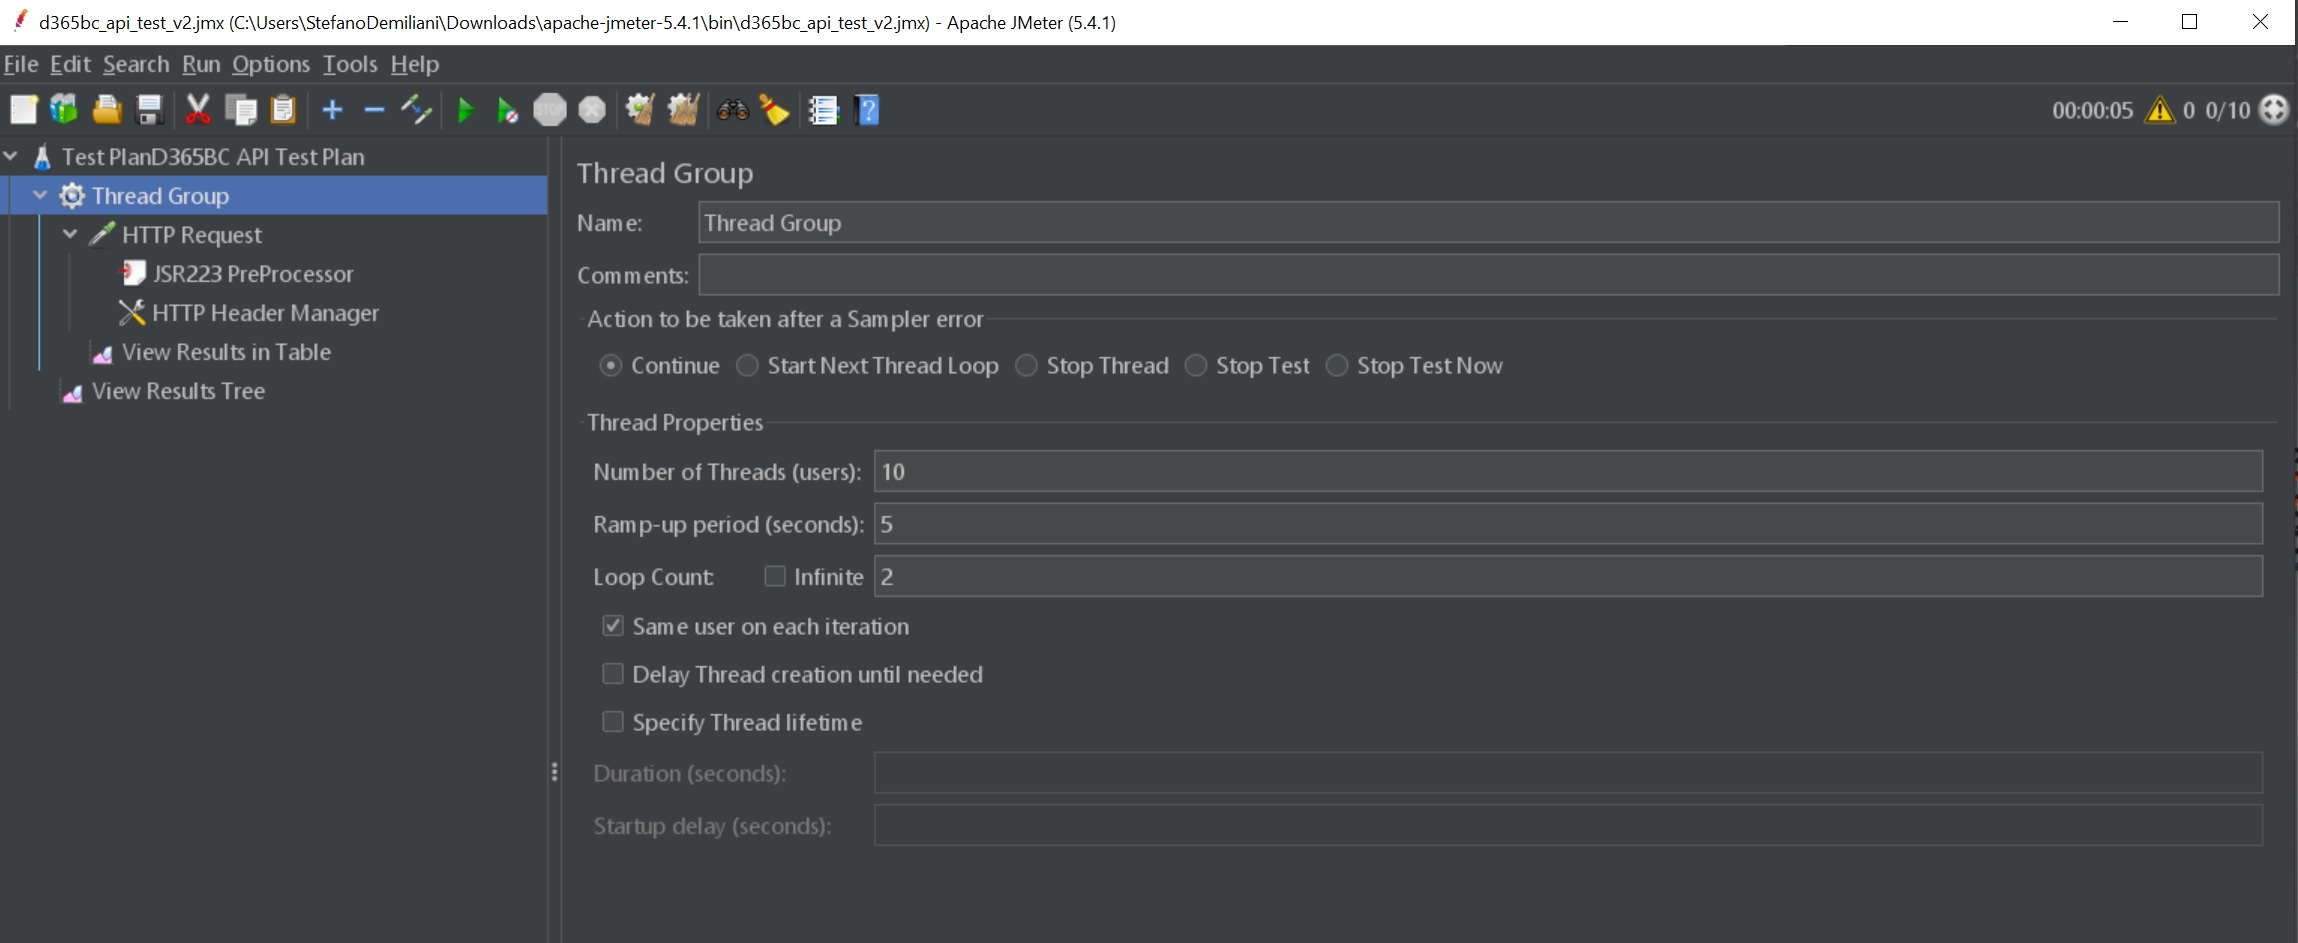
Now we’re ready to do a real load test. If you select the Thread Group, you can see the 3 following parameters:
- Number of Threads (users): The number of users that JMeter will simulate.
- Ramp-Up Period (in seconds): The duration of time that JMeter will distribute the start of the threads over (how long it will take to start the execution of all threads).
- Loop Count: The number of times to execute the load test.
This is a quite tricky calculation that can be more clear with some samples I think.
If we set Thread Count = 20, Ramp Up Time (Seconds) = 100 and Loop Count = 1, every 5 seconds (100/20) 1 Thread / Request will hit the server. Execution will start with one request at a time. If we set Thread Count = 20, Ramp Up Time (Seconds) = 100 and Loop Count = 4, every 5 seconds (100/20) 4 Thread / Requests will hit the server. Once the first thread completes the first round of execution, it will start 2nd loop by executing same HTTP request. Execution lasts until all 20 threads executes all HTTP requests 4 times.
Here, a first test for 10 users where in 0,5 seconds 2 requests will be sent to the server:
Let’s run the test:

All the requests have Status = Success. Latency shows he number of milliseconds that elapsed between when JMeter sent the request and when an initial response was received, Sample Time is the number of milliseconds that the server tooks to serve the incoming request (response time + latency).
Now let’s do a new test, with 100 users in a ramp up period of 2 seconds with 20 loops (20 requests in 0,2 seconds):

Let’s run the test, and here the result:
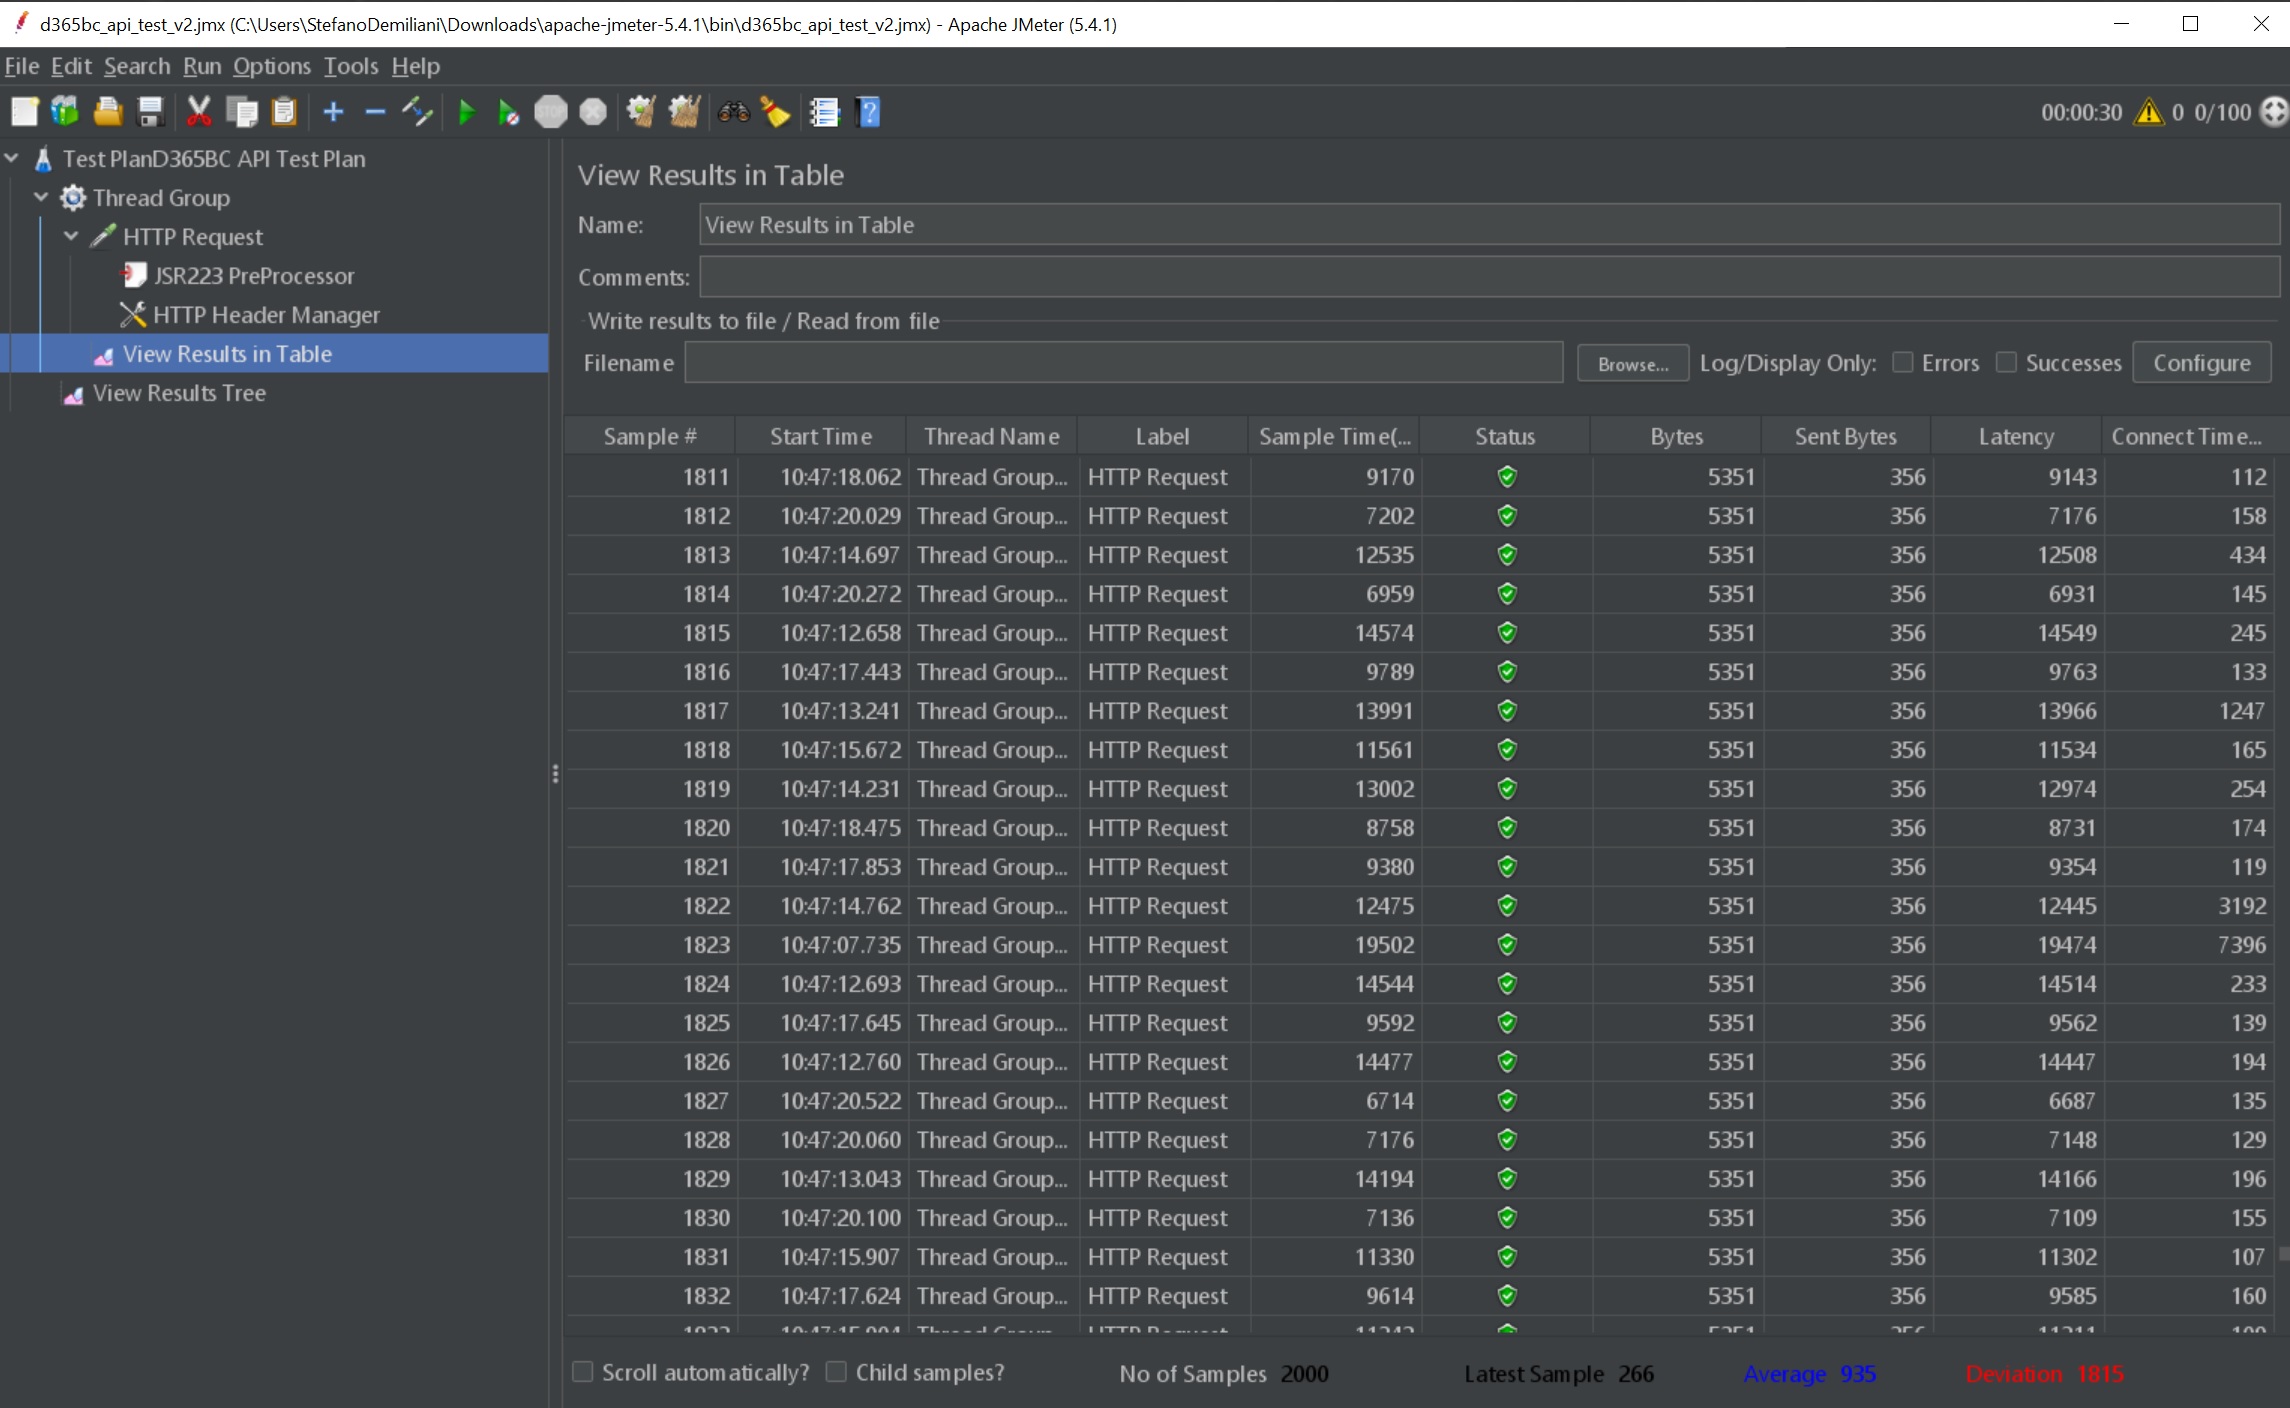
We can see that after a certain number of requests, the response time increases.
Let’s a third test as follows:
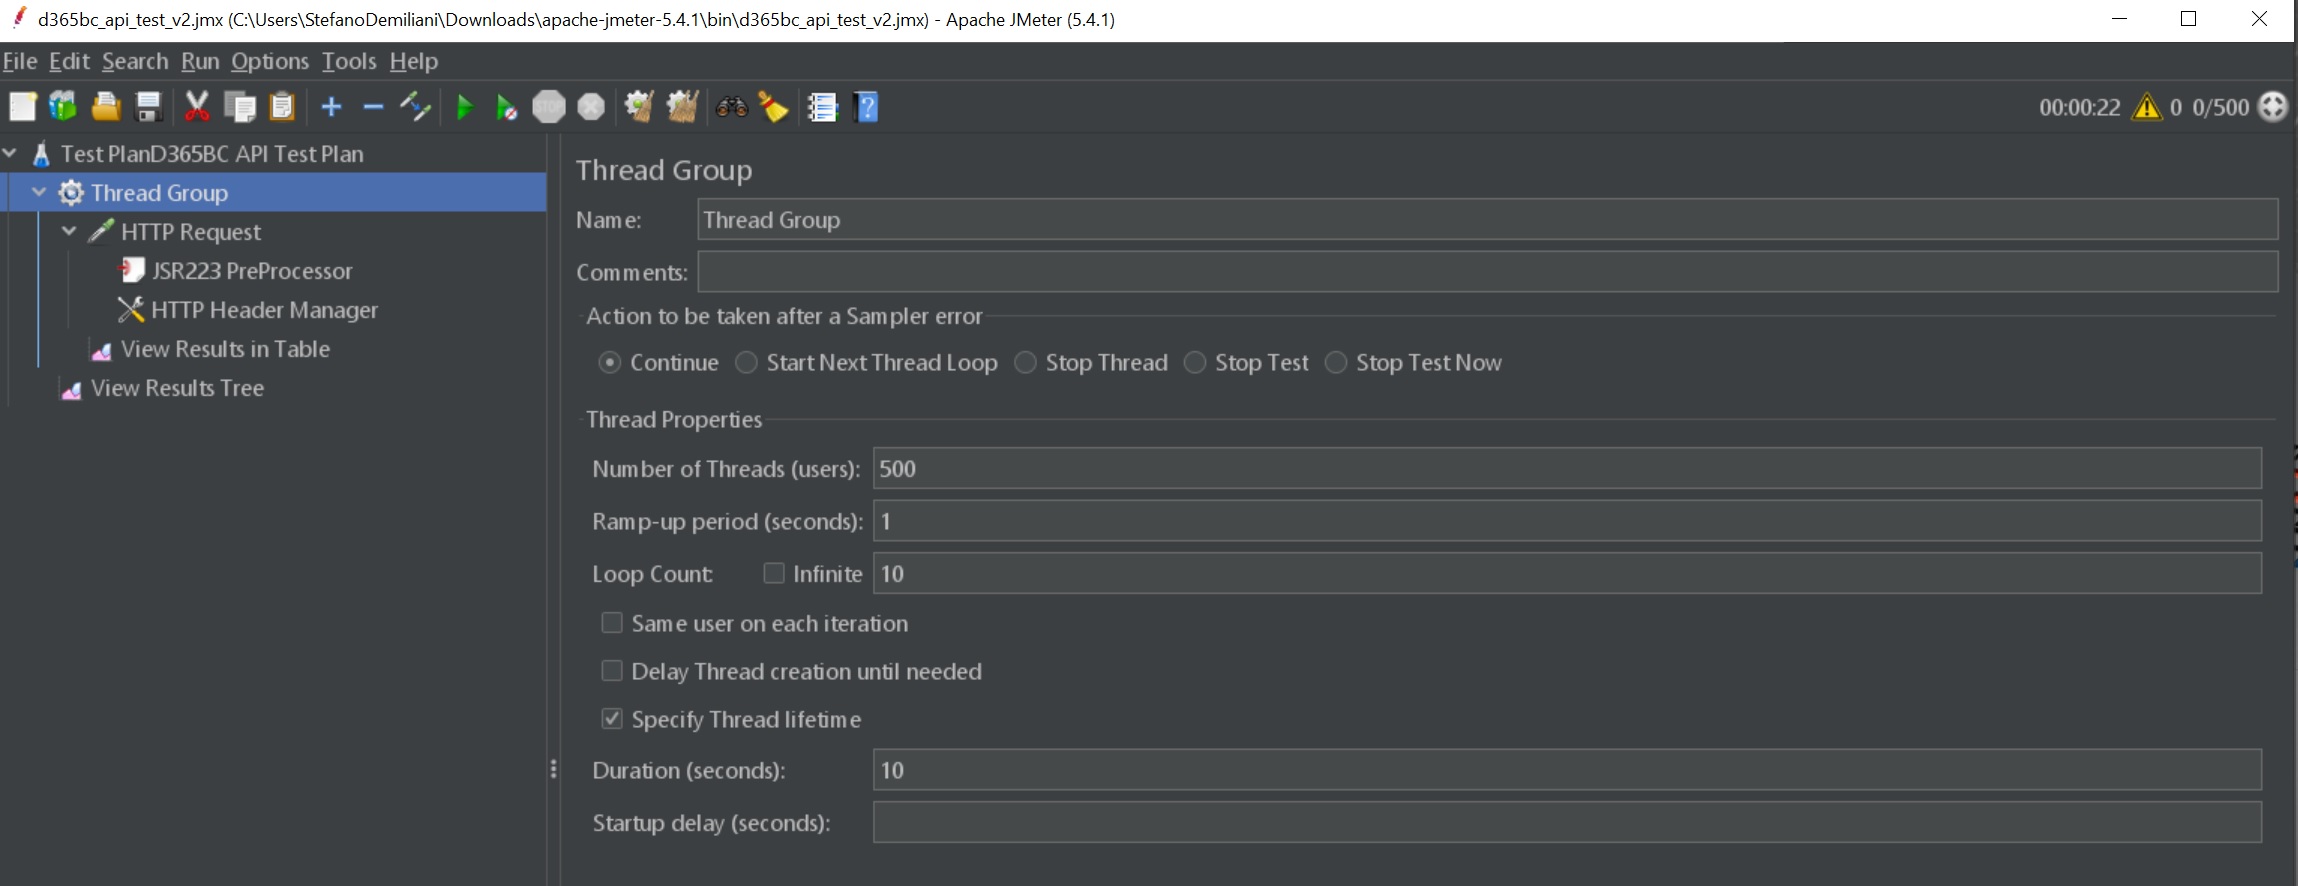
Here we set 500 users with a ramp-up period of 1 seconds with a loop of 10 (10 requests in 0,002 seconds, 500 requests per minute). This is above the API limit of the SaaS platform. Results:
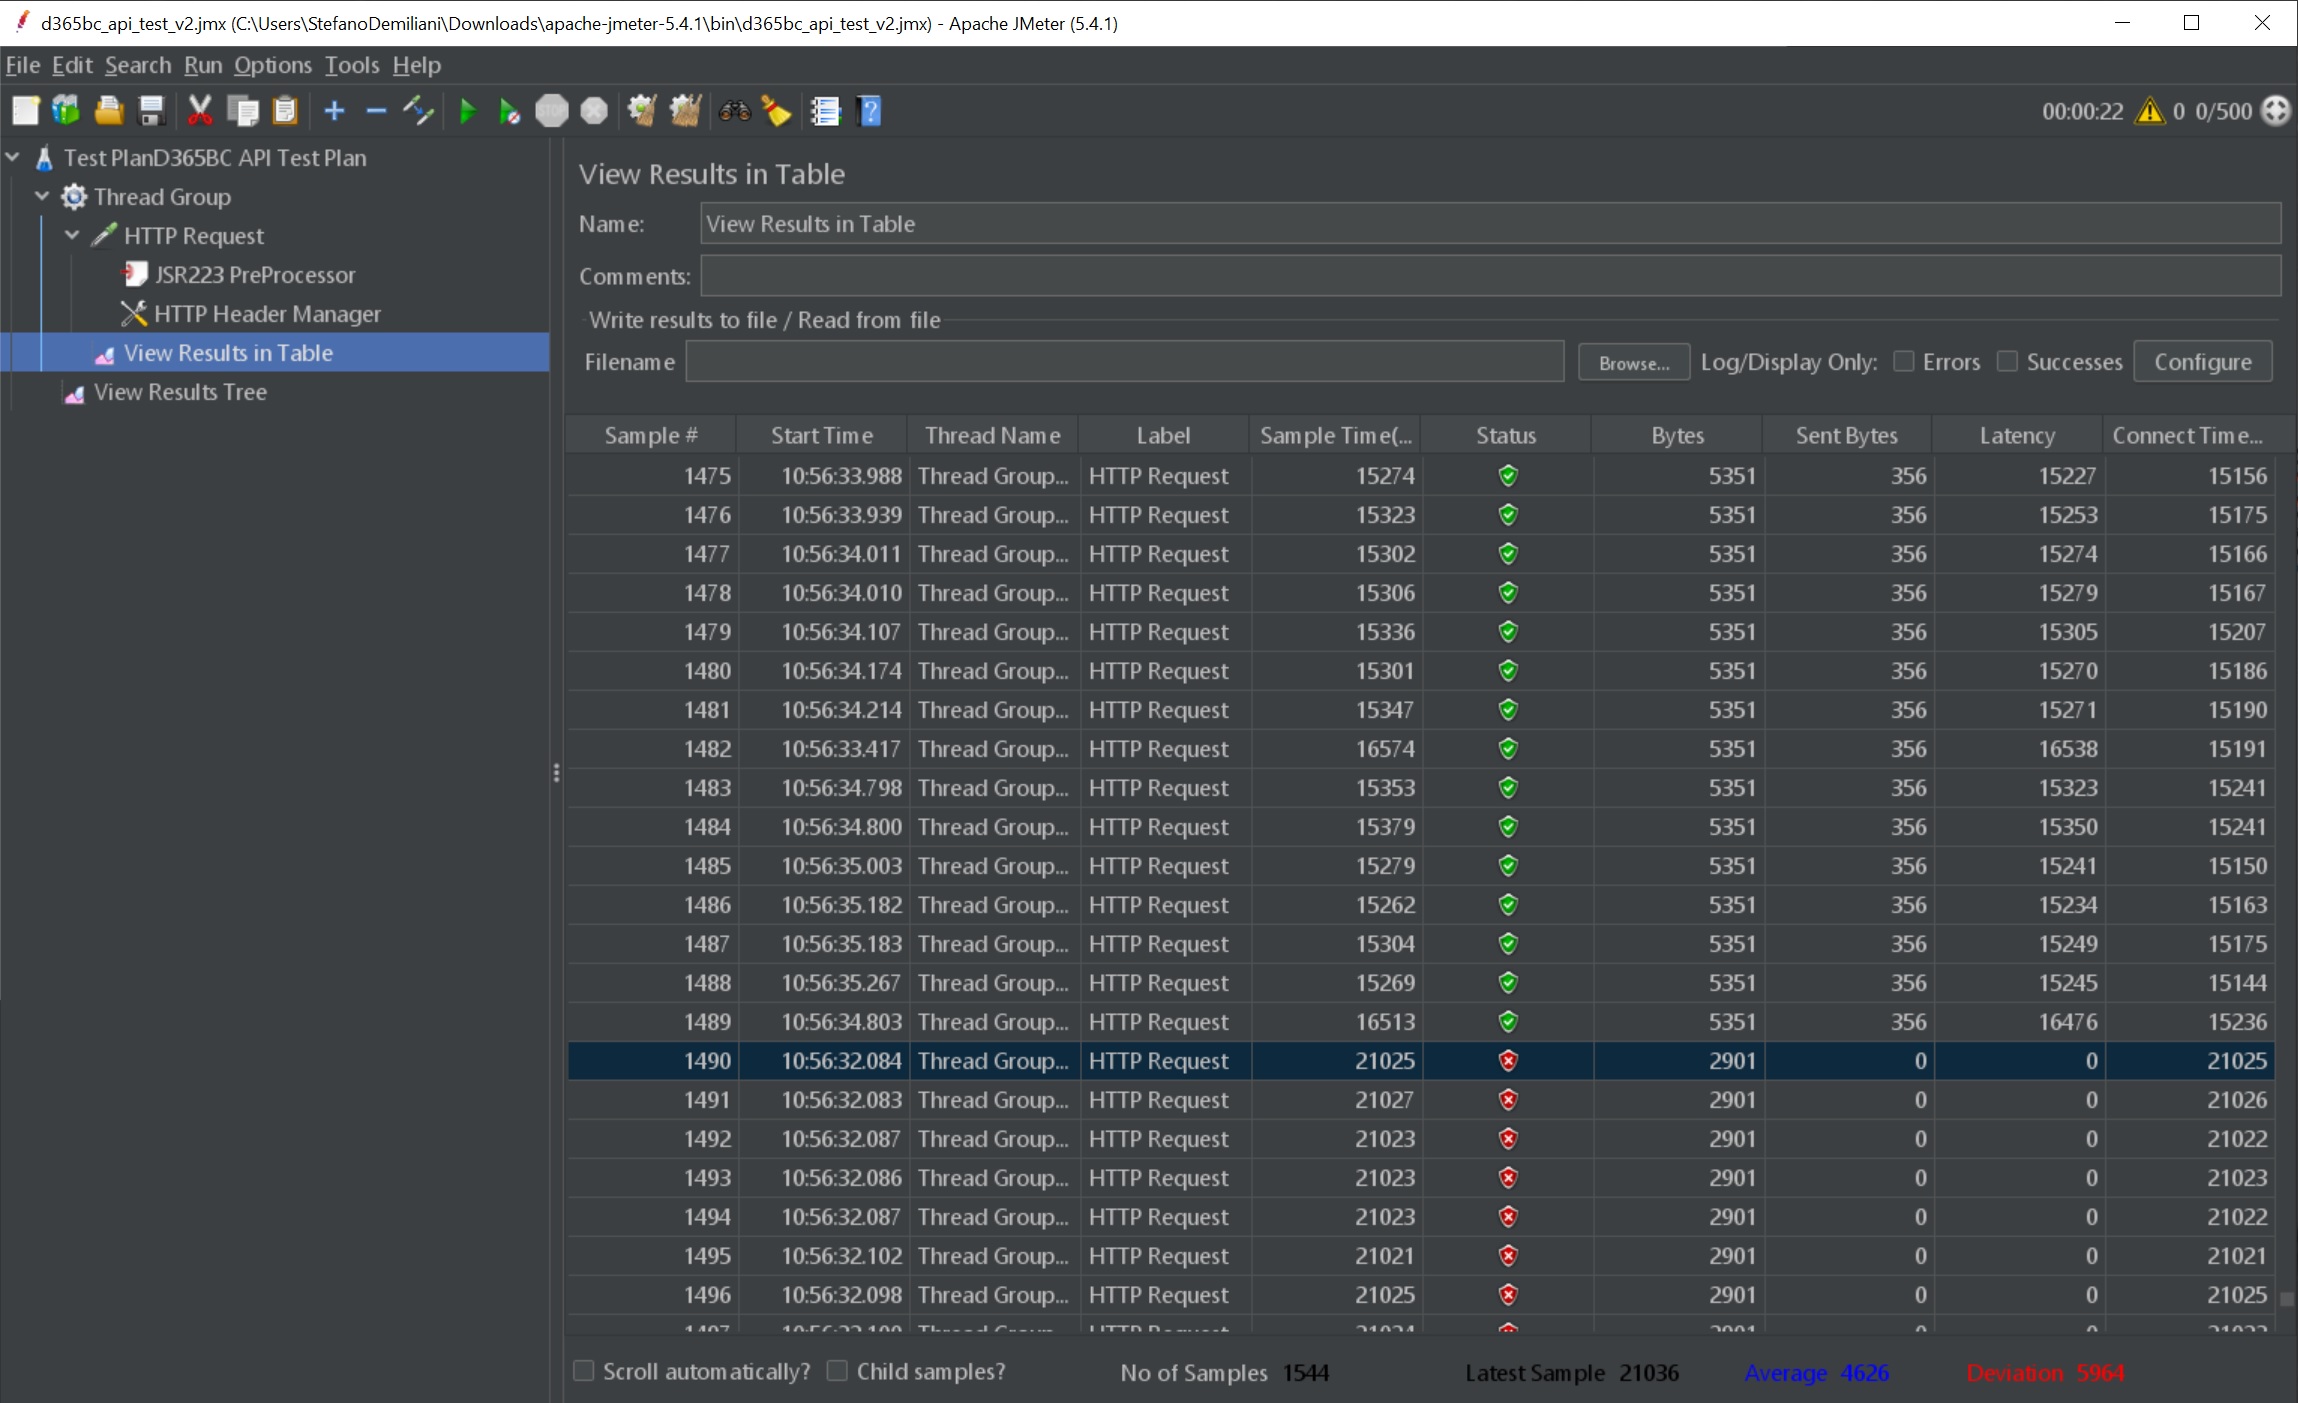
As you can see, after a certain limit the API requests start failing (as expected).
As you can see, JMeter is a nice tool for doing performance testing. You can do different types of testing (like distributest testing, ramp-up etc.) and having also different types of outputs:
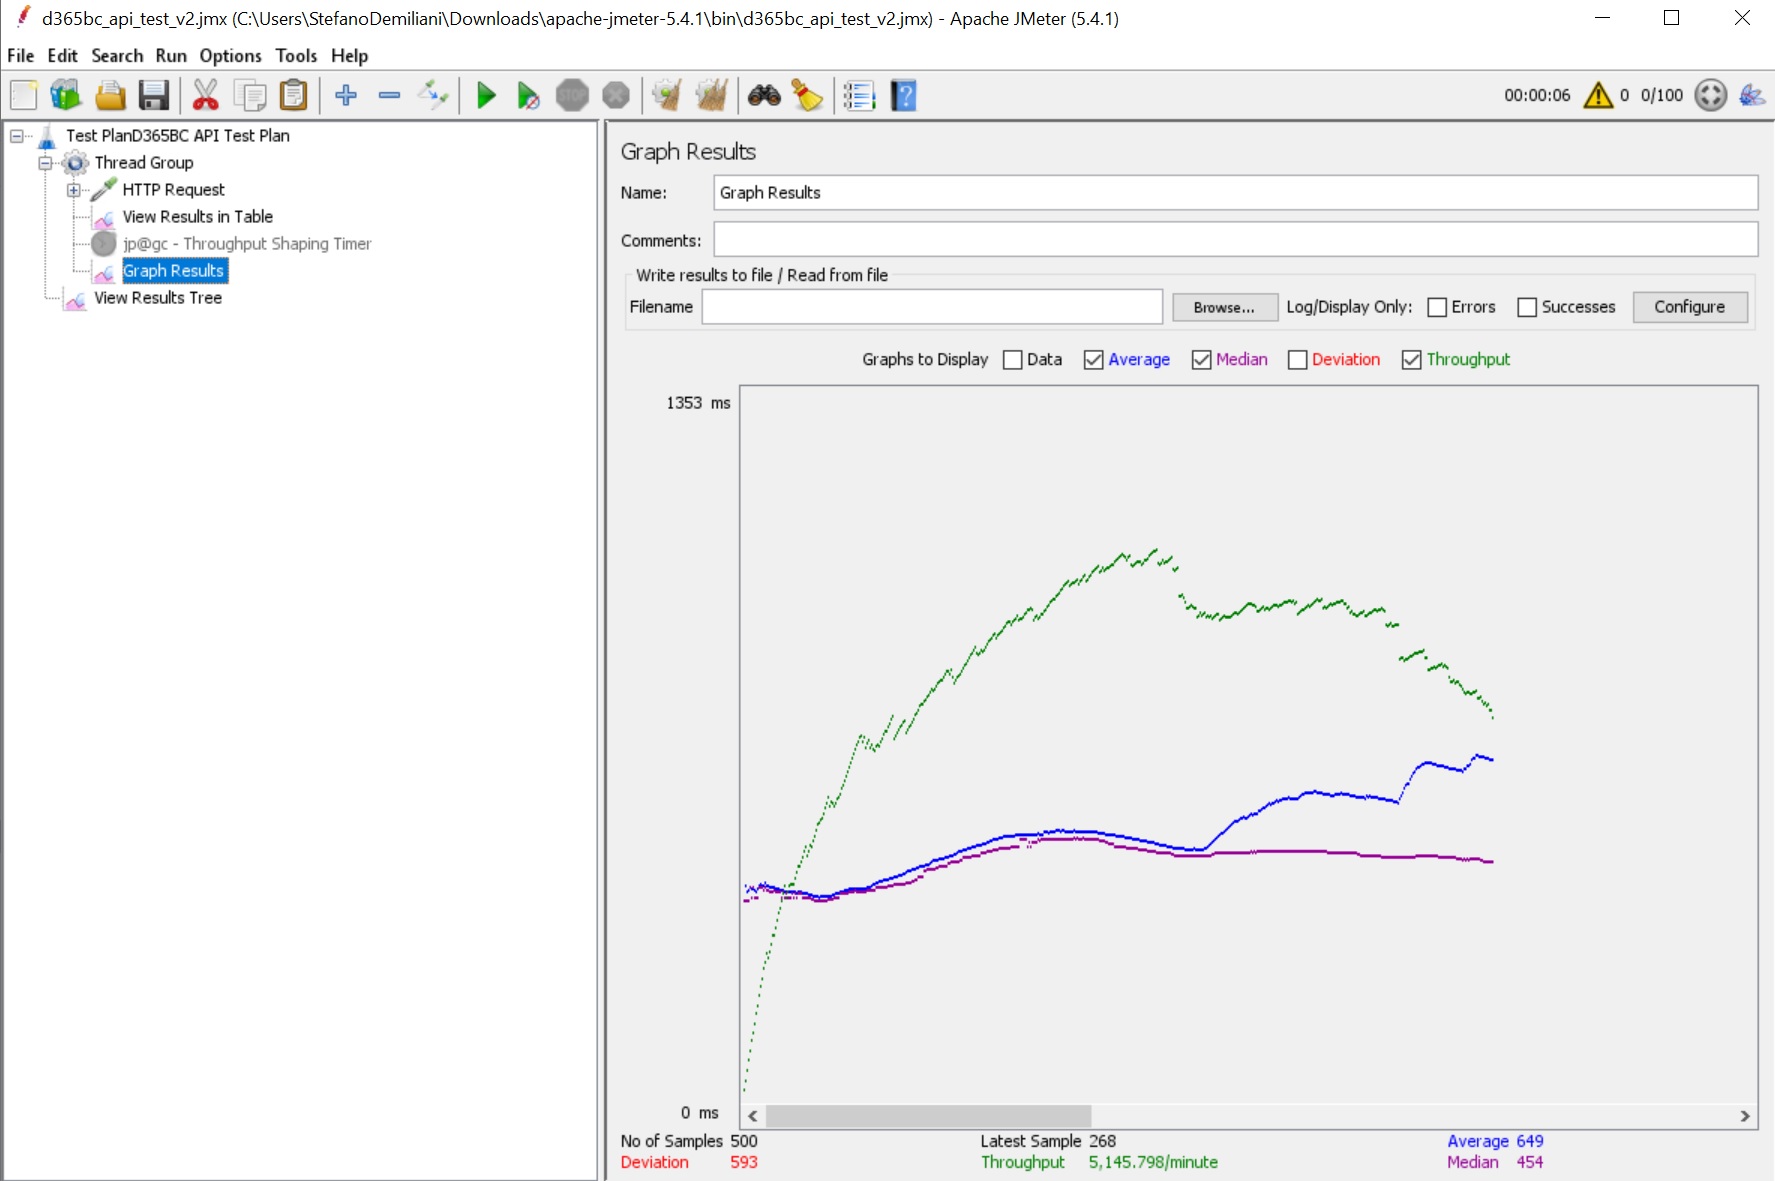
With JMeter you can test different types of APIs and check how the endpoints react to different loads. You ca then identify possible issues and so remove the bottlenecks or perform optimizations like caching, load balancing and more. If you’re doing integrations and you want to simulate how your integration could react on different loads, this is something I recommend to check.

Hi Stefano!!
Thanks for your post!!
Let me talk to you, I going to need to execute a performance testing over Dynamics CRM 365, I executed testing in Dynamics CRM Desktop, but now I need to test in web, but I never used the Dynamics 365 Web, so I want to know how D365 CRM works among browser and the server, if D365 sends a postback of all the form (like before) or now it’s working with API’s Restful.
It’s to I be able to measure the effort of doing this test.
Thanks again
LikeLike