

Corporate environmental responsibility has become a cornerstone of modern business strategy. Companies are under increasing pressure to demonstrate their commitment to sustainability, not only to meet regulatory requirements but also to align with consumer preferences and investor expectations.
An organisational carbon footprint is an essential component on the journey towards net-zero emissions and is the first building block towards any sustainability strategy.
A carbon footprint can also provide an initial climate risk and opportunities assessment by identifying emissions hotspots across your value chain. Companies all over the world measure and report their carbon footprint to their stakeholders and use the findings to inform their sustainability actions.
Collectig data and calculating emissions should be a goal for a green industry of the future. While the source and intensity of emissions generating activities differ, the calculation will typically follow the same structure:
Emissions = Activity Data * Emission Factor
An emission factor reflects the emissions intensity of an operation or activity. An appropriate emission factor will need to be selected to link each of your activities to their associated emissions.
For many EU businesses, carbon reporting is mandatory per the CSRD (Corporate Sustainability Reporting Directive). All large enterprises that do business in the EU (including those based outside of the EU) will need to disclose their emissions starting in 2024, including scope 3 value chain emissions.
More in details, in the case of the carbon footprint, the obligation to calculate and publish it is first imposed on companies with more than 500 employees (2024 report). The following year, carbon footprint reporting will also apply to companies with more than 250 employees (2025 report). And finally, for 2026, such an obligation will apply to a proportion of small and medium-sized enterprises: with the understanding, however, that they have the option until 2028 to report that they are not ready to calculate their carbon footprint.
But what is exactly a carbon footprint?
In summary, it is the total sum of greenhouse gas emissions associated directly and indirectly with an event, organisation or product, expressed in units of mass CO2e (carbon dioxide equivalent). The European Union’s current targets are to reduce greenhouse gas emissions by at least 55% by 2030 and then become climate neutral by 2050.
Is my ERP ready for a carboon footprint?
Dynamics 365 Business Central is becoming a “green ERP” by supporting sustainability. Starting from version 24 you will start seeing sustainability features inside the product.
Fist af all, it introduces the new Chart of Sustainability Accounts page, that forms the foundational structured list used for recording all emissions data:

Sustainability Journals can then be used to record sustainability-related activities and metrics within an organization, using the same user experience as other journals in Business Central. Within the journal, users have the option to input emissions manually if they possess the necessary information. Alternatively, if they lack this data, they can utilize built-in formulas to accurately calculate emissions based on specific known parameters corresponding to various types of sources and accounts.

When posting with a Sustainability Journal, entries are generated on the Sustainability Ledger that organizes all emission data according to the Chart of Sustainability Accounts for reporting purposes.
What about my cloud services?
And what about the different cloud services that a company nowadays has? How can I track a carbon footprint for cloud services?
If you’re using Azure services, probably few of you know that Azure has a service (currently in preview) called Azure carbon optimization that helps you measure and minimize the carbon impact of your Azure footprint. With it, you can:
- Find opportunities to optimize your resource utilization to lower your carbon emissions and costs.
- Track and analyze the emissions associated with your Azure resources and subscriptions.
- Access carbon data and insights through APIs and exports.
Azure Carbon Optimization provides emissions data for all Azure resource types. Emissions calculation is based on billing and usage of these resources. Emissions data is provided at a monthly grain for the last 12 months. Data for the previous month is available by the 19th day of the current month (ex. data for the month of April will be available by May 19).
To start using Azure Carbon Optimization, go to the Azure Portal and search for Carbon Optimization (currently listed as a preview). On the Carbon optimization page, select Subscriptions to filter the subscriptions for which you want to see the emissions data. You can choose one or more subscriptions.
Please note that carbon emissions data within Carbon Optimization is accessible only to users with to Carbon Optimization Reader, Subscription Owner or Subscription Contributor roles assigned for the selected subscriptions.
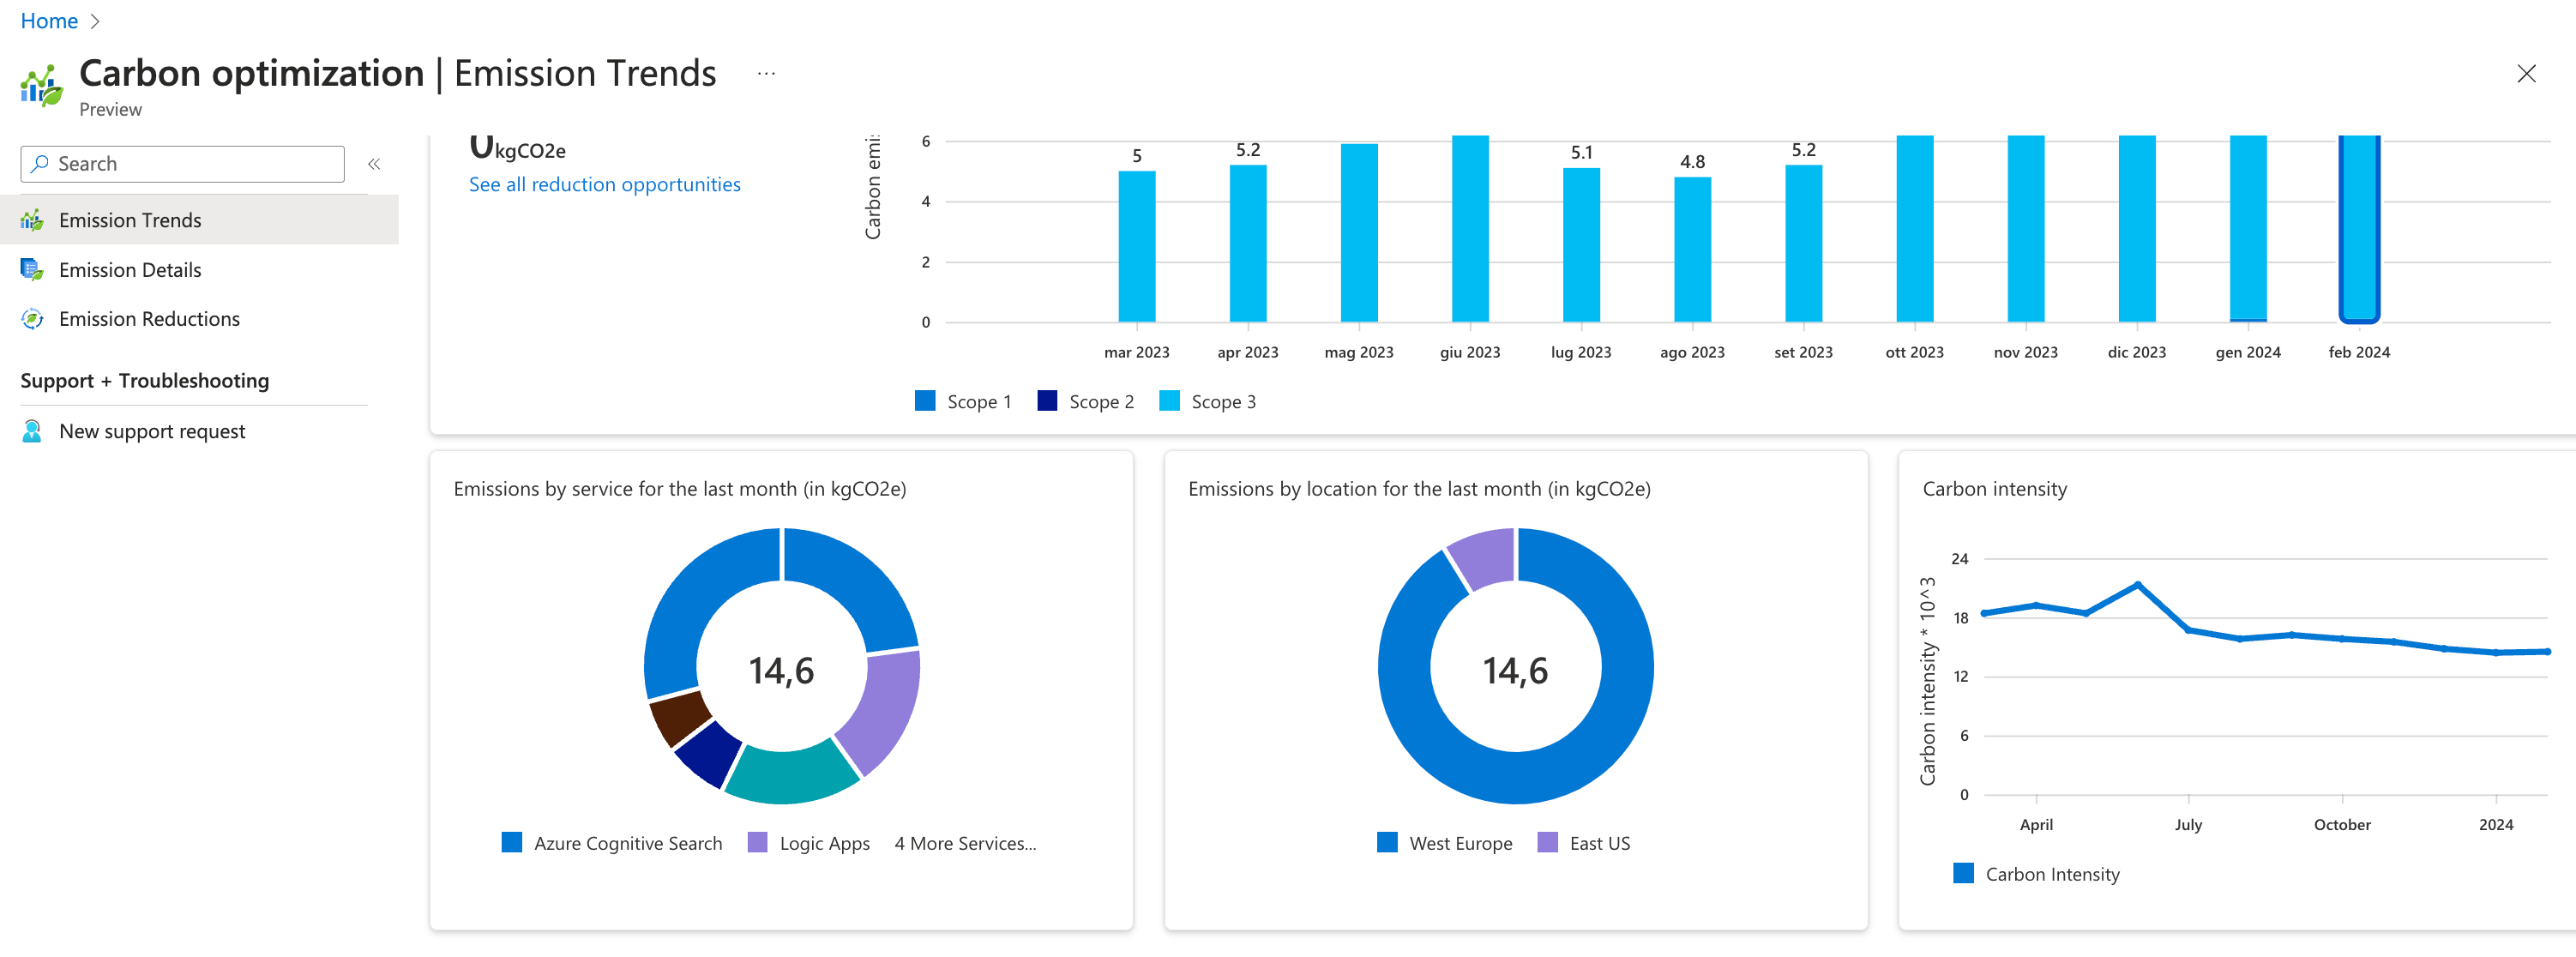
When access is granted, you can use the Emissions trends page to understand the general patterns in your cloud emissions, and identify the factors and drivers that affect your carbon footprint. This page shows you a trend of your monthly carbon emission data over the last 12 months:

The emissions data presented here is calculated based on the methodology documented in this white paper: A new approach for scope 3 emissions transparency. By going on a bar, you can see thre details per scope accordingly to the mentioned document. Scopes classifications are the following:
- Scope 1: direct greenhouse gas emissions from onsite fuel combustion (generators, vehicle fleet).
- Scope 2: indirect greenhouse gas emissions such as emissions from electricity provider.
- Scope 3: other indirect greenhouse gas emissions from the value chain.
You can select View emissions equivalents under Total carbon emissions and Carbon emissions for the last month to see equivalent emissions as calculated by the United States EPA Greenhouse Gas Equivalents calculator:

Below the monthly trend chart, the previous month’s emissions are broken down by service and by location along side the carbon intensity trend for the selected subscriptions. The carbon intensity trend shows your emissions compared to your utilization of Azure:
The emissions details page shows you a detailed breakdown of your carbon emission with a breakdown by Subscription (default):

but you can also go into details by Resource groups, Resources, Services, and Location (with detailed numbers if you click on a point in the chart):

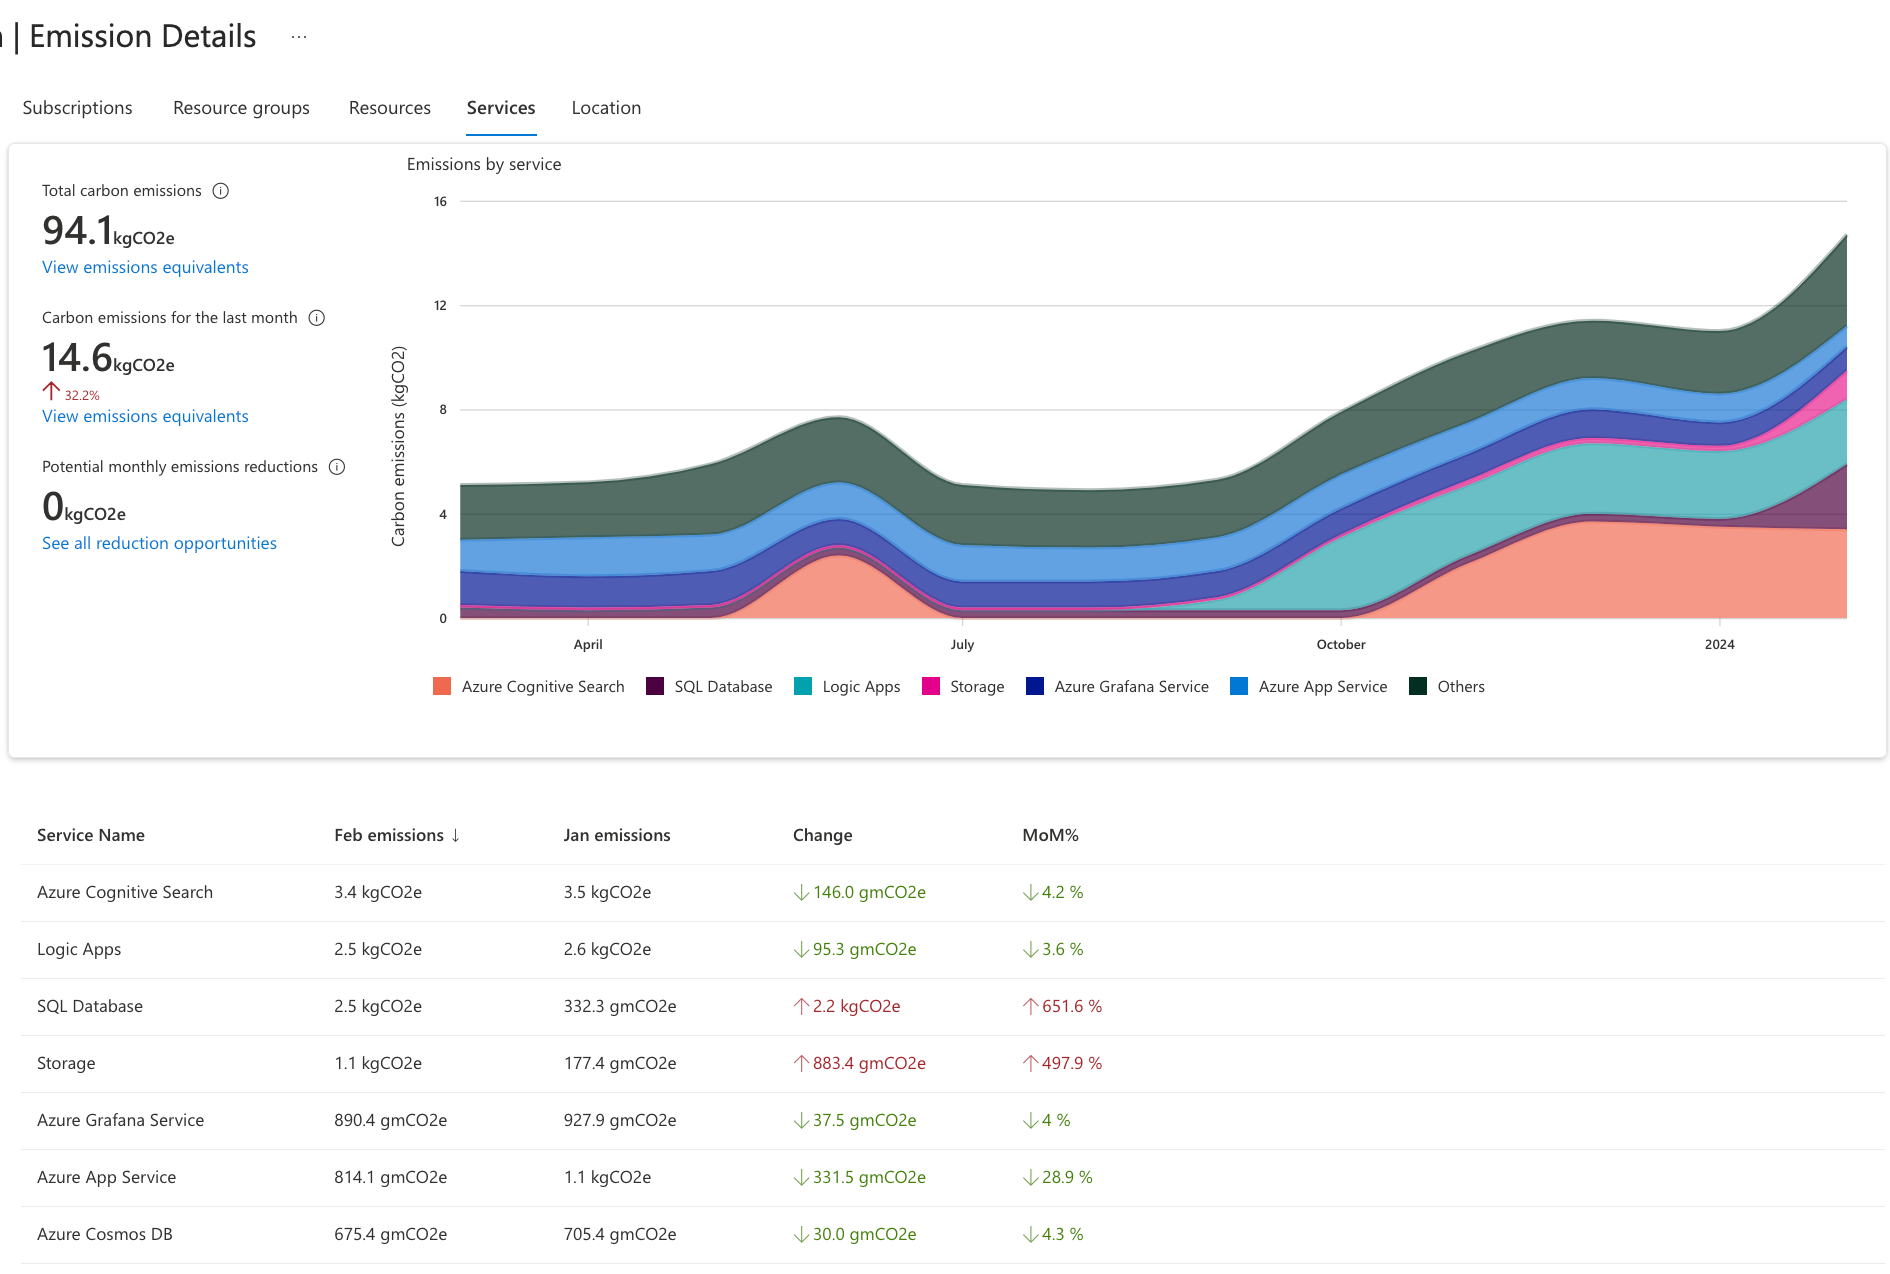
The emission details page is usefult to:
- Identify top emissions contributors
- Identify significant month over month changes in emissions
- Audit resources and shut down or delete resources that shouldn’t be running
- Compare emissions of different subscriptions, resource groups, and resources
- Track the impact of changes on emissions
- Narrow down emissions hotspots based on emissions data
Then, the Emission reductions page provides optimization recommendations that are generated based on your resources’ utilization. The recommendations include switching to more efficient SKUs or reducing idle or unused resources. You can view the estimated carbon savings and cost implications of each recommendation.
You can export your emissions data in CSV format from the Emissions Trends page and the Emissions Details page. You can also access your emissions data programmatically using REST APIs.
Conclusion
With this set of tools you’re ready to create your first company carboon footprint analysis and you have all the tools to be compliant with the new regulation.
Remember that reducing emissions is a shared responsibility between the cloud provider and the customer/partner designing and deploying applications on the platform.
As a cloud provider, Microsoft is responsible for the data centers hosting your applications. However, deploying an application in the Microsoft cloud doesn’t automatically make it sustainable, even if the data centers are optimized for sustainability. Applications that aren’t optimized may still emit more carbon than necessary. Just imagine deploying a service on Azure with a big amounf of associated resources and then using it at 10%. This service is consuming more than needed because the provisioned resources are underutilized, leading to unnecessary emissions.
To be green, it’s extremely important to create efficient applications and cloud services by optmizing their usage of datacenter capacity in the best way possible. Sustainability is always a shared responsibility goal that must combine the efforts of the cloud provider and the customers in designing and implementing applications.
