

Monitoring is an essential task for handling a cloud tenant at best. Azure has built-in features for monitoring a tenant, but sometime these features are accessible only to admins. How can you be proactive on problems? How you can enhance your tenant monitoring experience? How can avoid the access to the Azure Portal for handling the tenant’s telemetry? In this article (my session for Azure Spring Clean 2022) I will try to suggest tips and tricks for improving the Azure monitoring experience and for moving telemetry from admins to your user’s fingertips.
What is Azure Monitor
Azure Monitor is a monitoring solution for the Azure platform. It permits you to collect data in forms of metrics and logs from all your Azure resources and it permits you to analize that data in order to monitor performances, check service health, troubleshooting problems, create interactive monitoring dashboards and more.
The following diagram gives you an high level overview of Azure Monitor:

Data in Azure Monitor are collected in forms of metrics and logs.
Metrics are essentially the measurements of resource aspects (numerical values) in a given period of time. Logs are instead data organized in forms of records with various properties and metadata. Telemetry such as events and traces are stored as logs in addition to performance data so that it can all be combined for analysis.
The Azure Monitor service supports Azure Lighthouse, which lets service providers sign in to their own tenant to manage subscriptions and resource groups that customers have delegated.
Azure Monitor logs
In order to collect data from Azure Monitor, you need to setup a Log Analytics workspace. In the Azure Portal, search for Log Analytics workspaces and create a new workspace:

A new monitoring workspace will be created.
Now you can start ingesting data from your Azure resources into this monitoring workspace and you can create an Azure Application Insights resource linked to this workspace (Application Insights is a feature of Azure Monitor that provides extensible application performance management (APM) and monitoring for live cloud applications).
Real world scenario
In this scenario, I have a business critical B2B website deployed on Azure where a fictious company sells items:

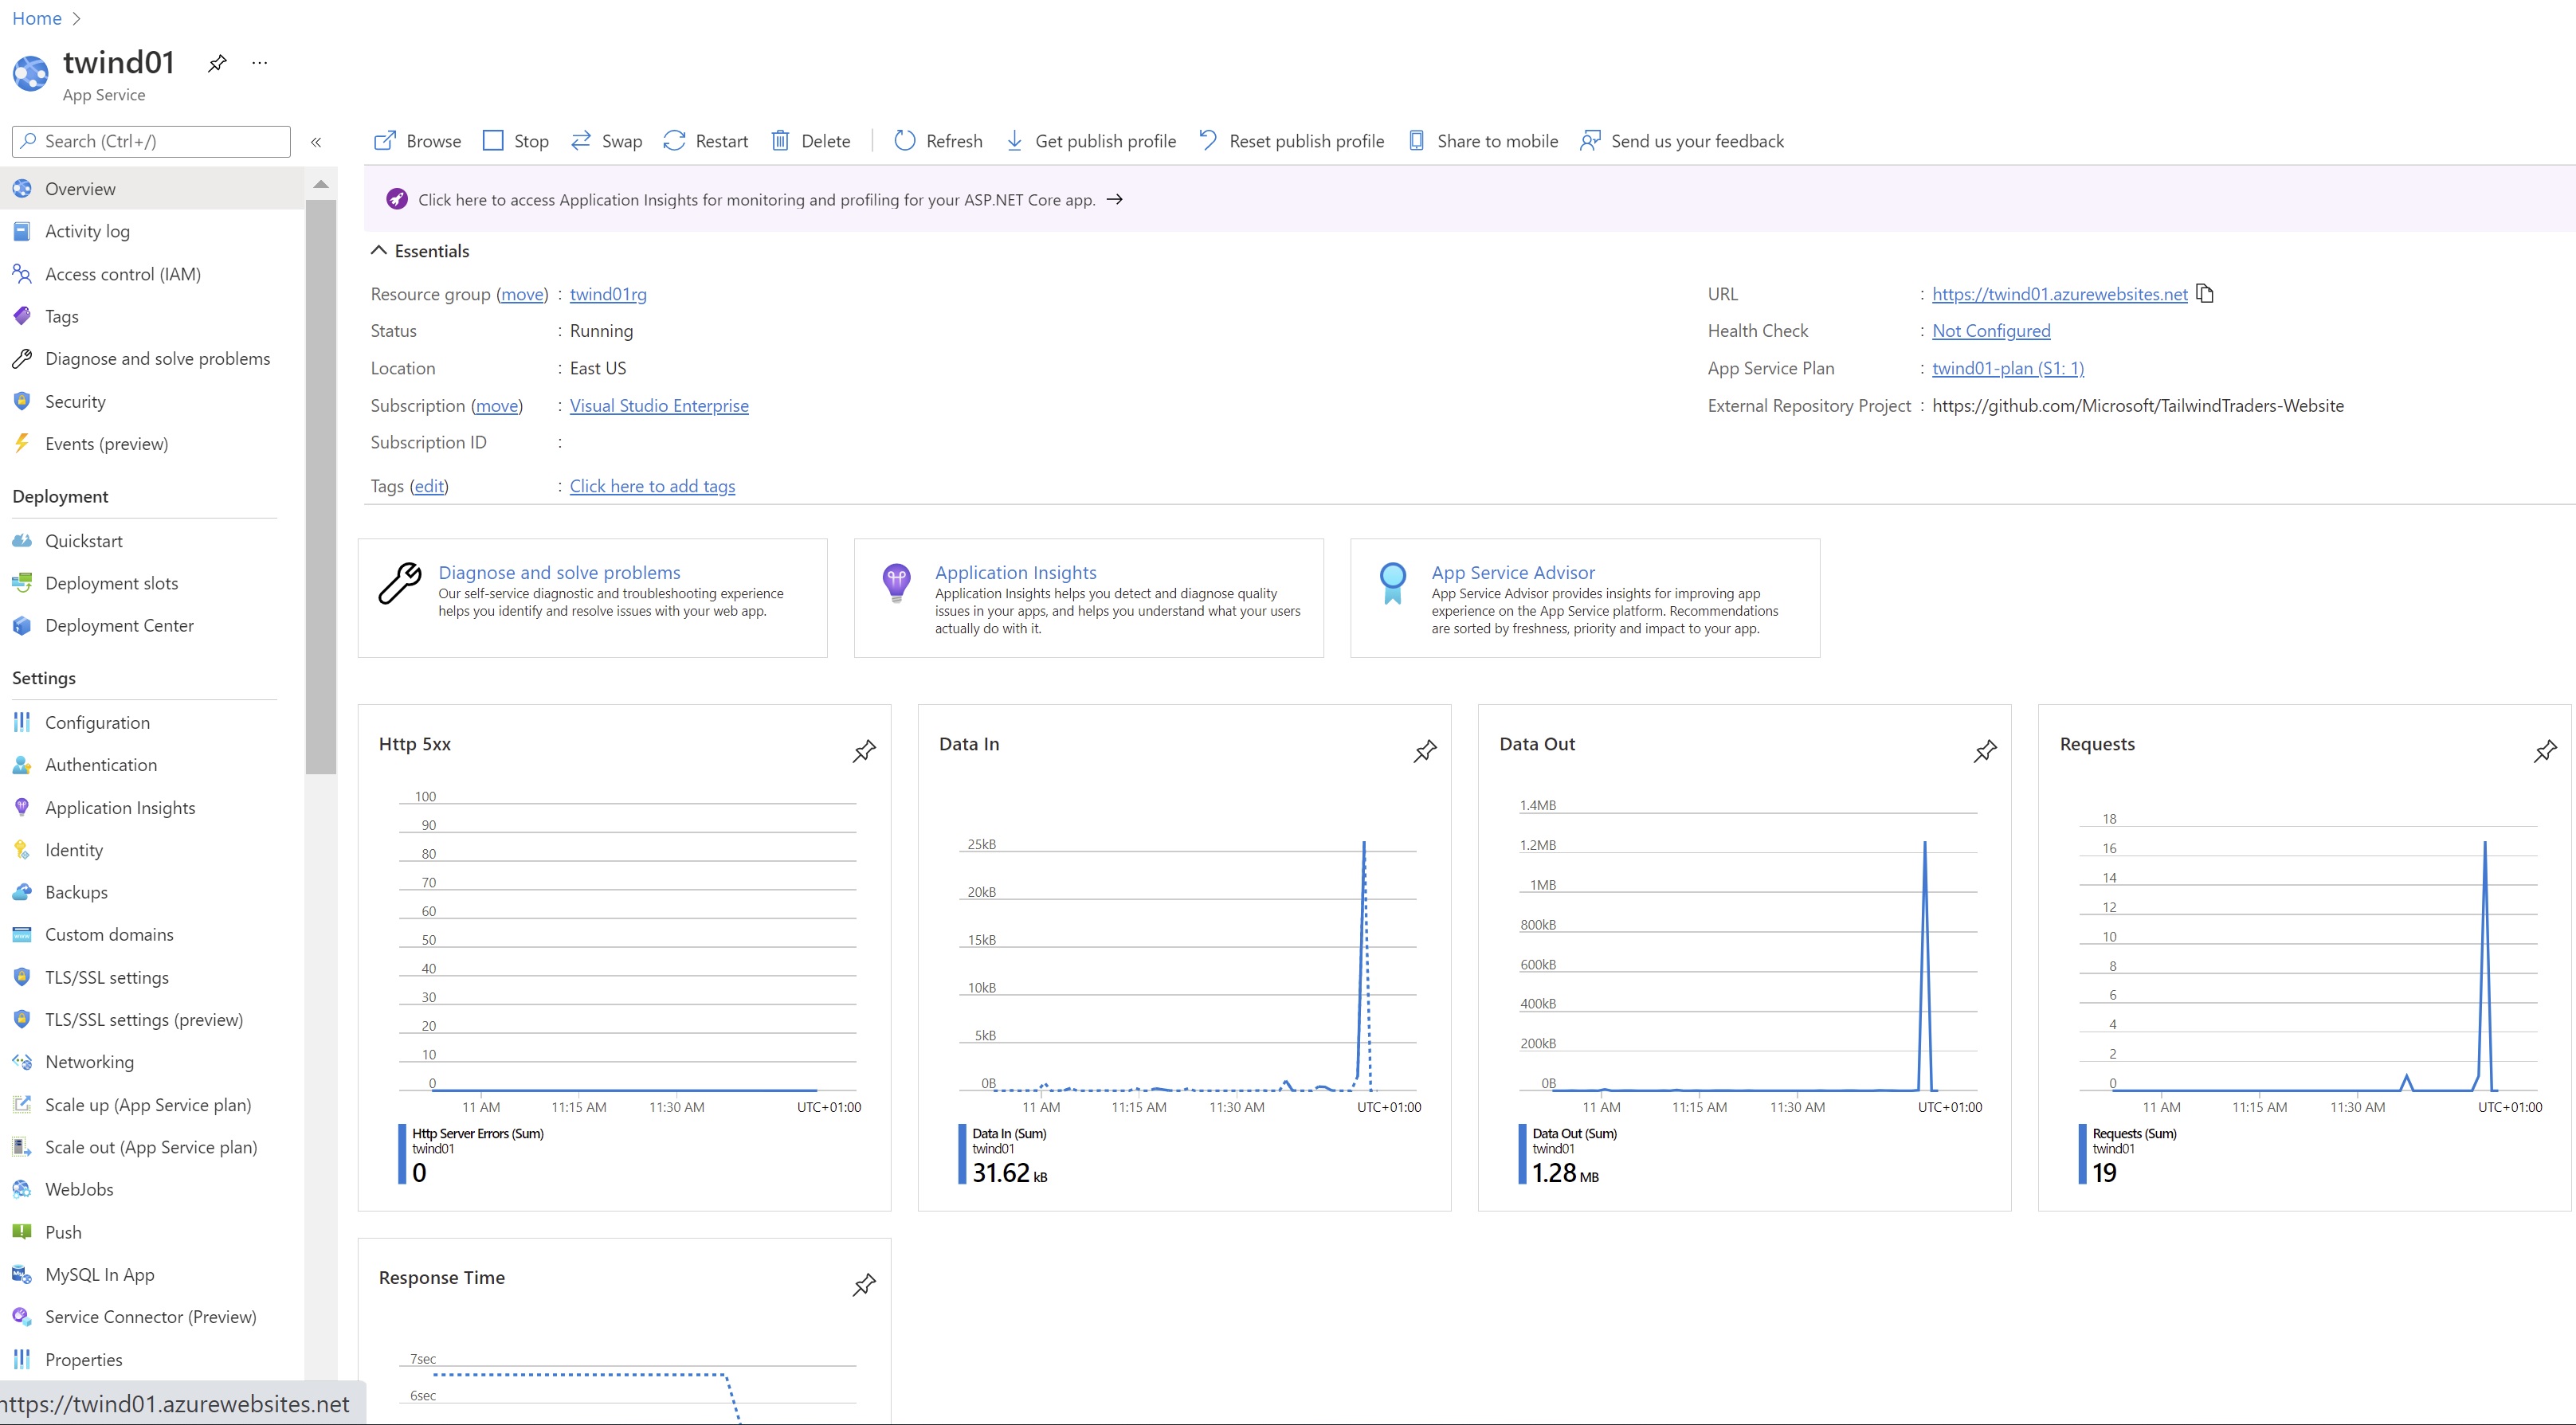
This web application is deployed on Azure in an App Service instance (here called twind01):
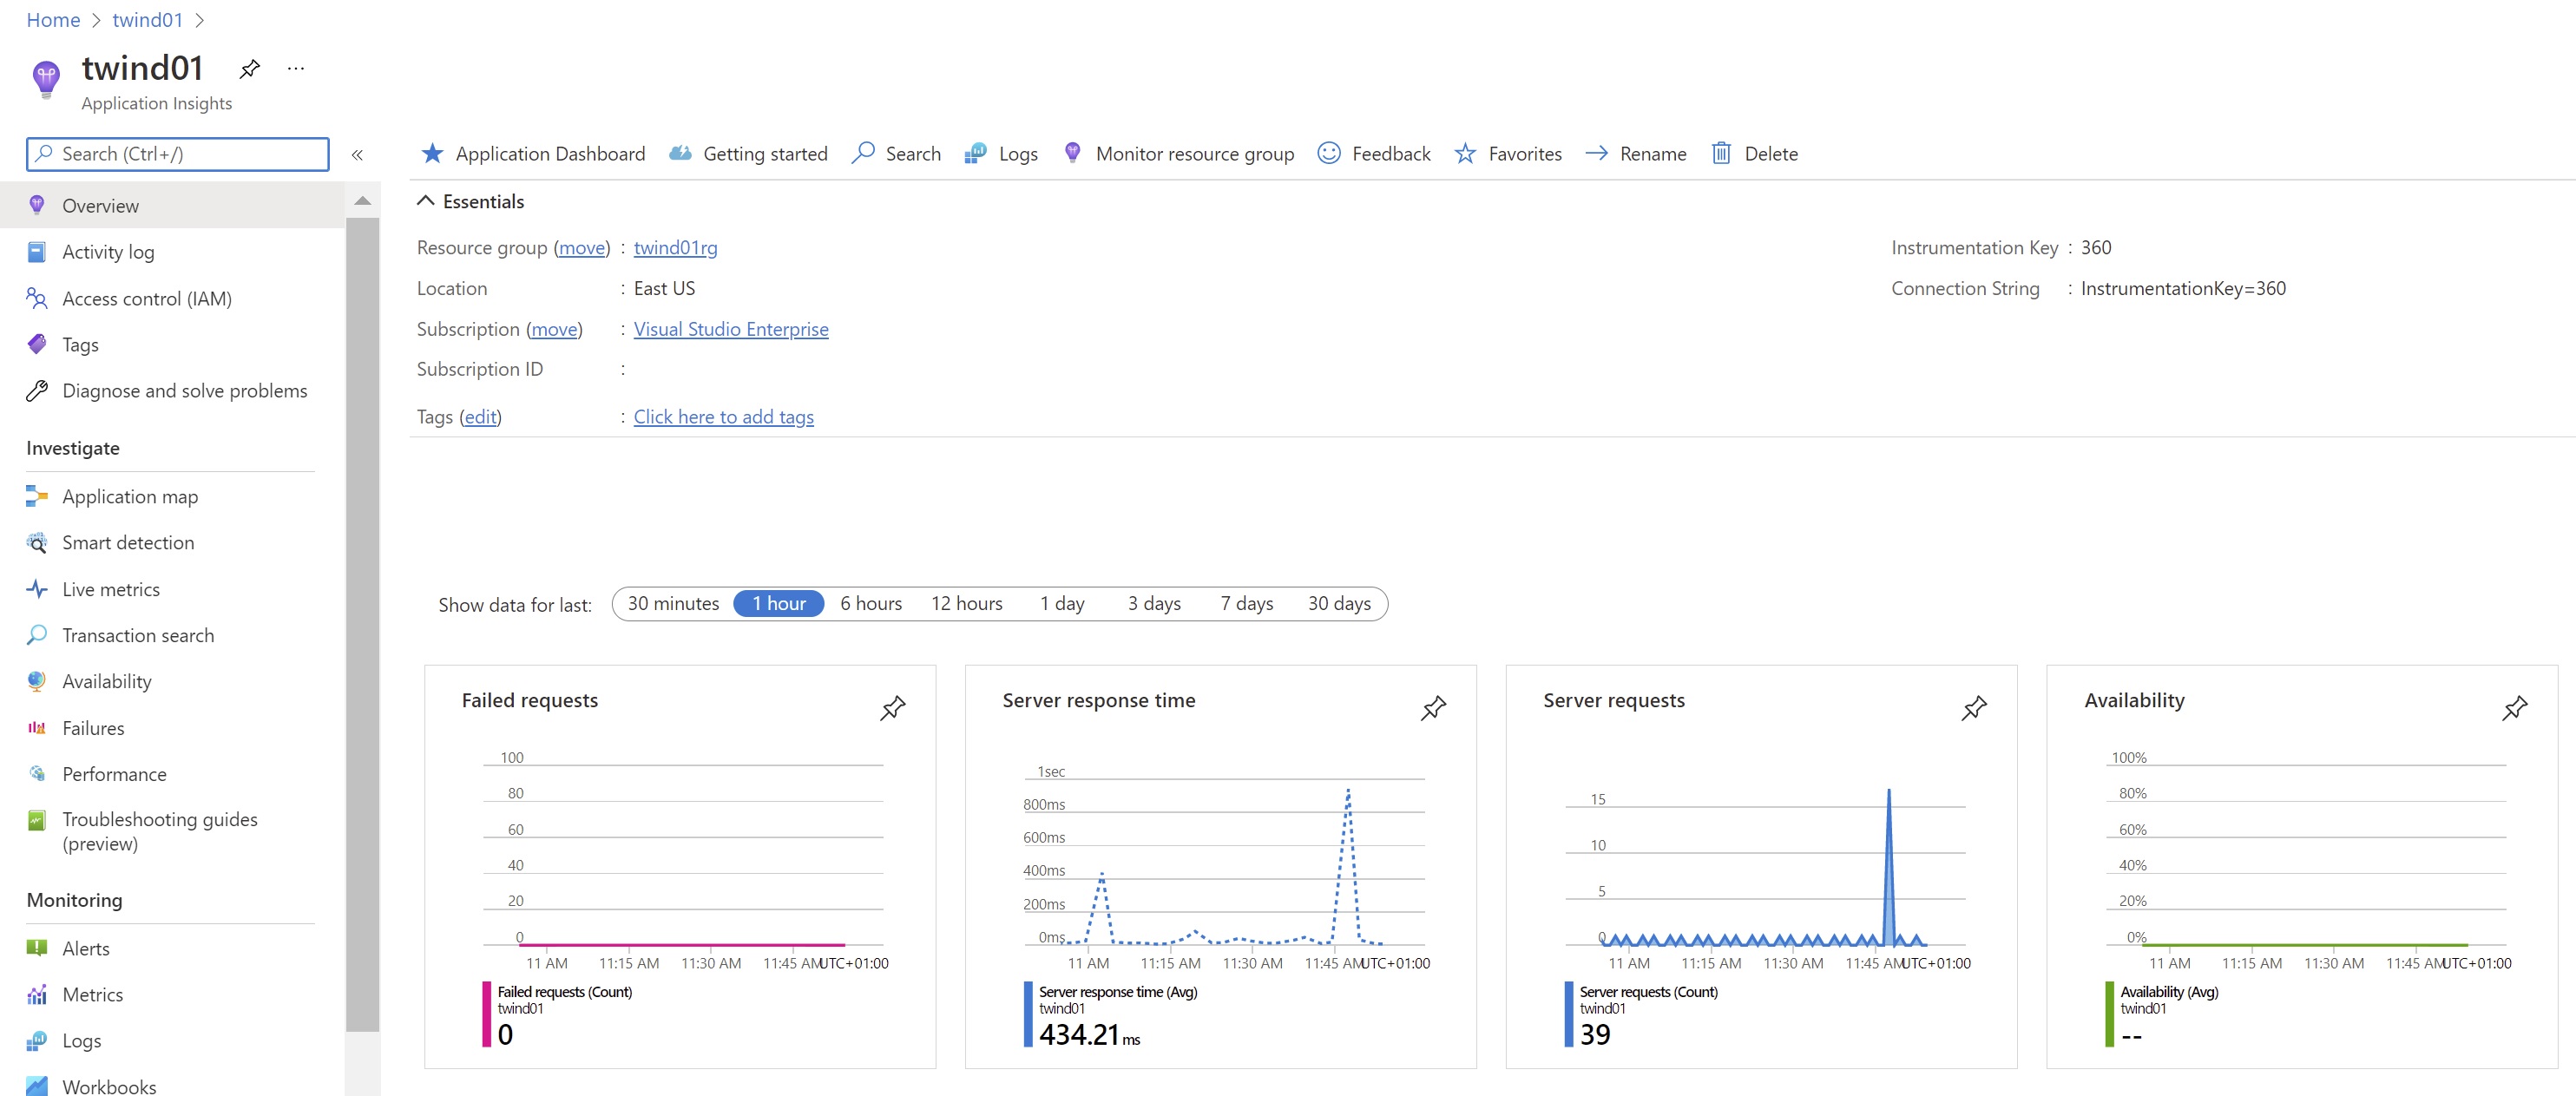
The twind01 App Service instance is connected to an Azure Application Insights instance (always called twind01) where the website telemetry is collected:
From the twind01 Application Insights instance, we can monitor different aspects of our B2B application. We can monitor the response time of the different interactions with the website with the details of the incoming calls:

We can see in real-time the live metrics of the website:

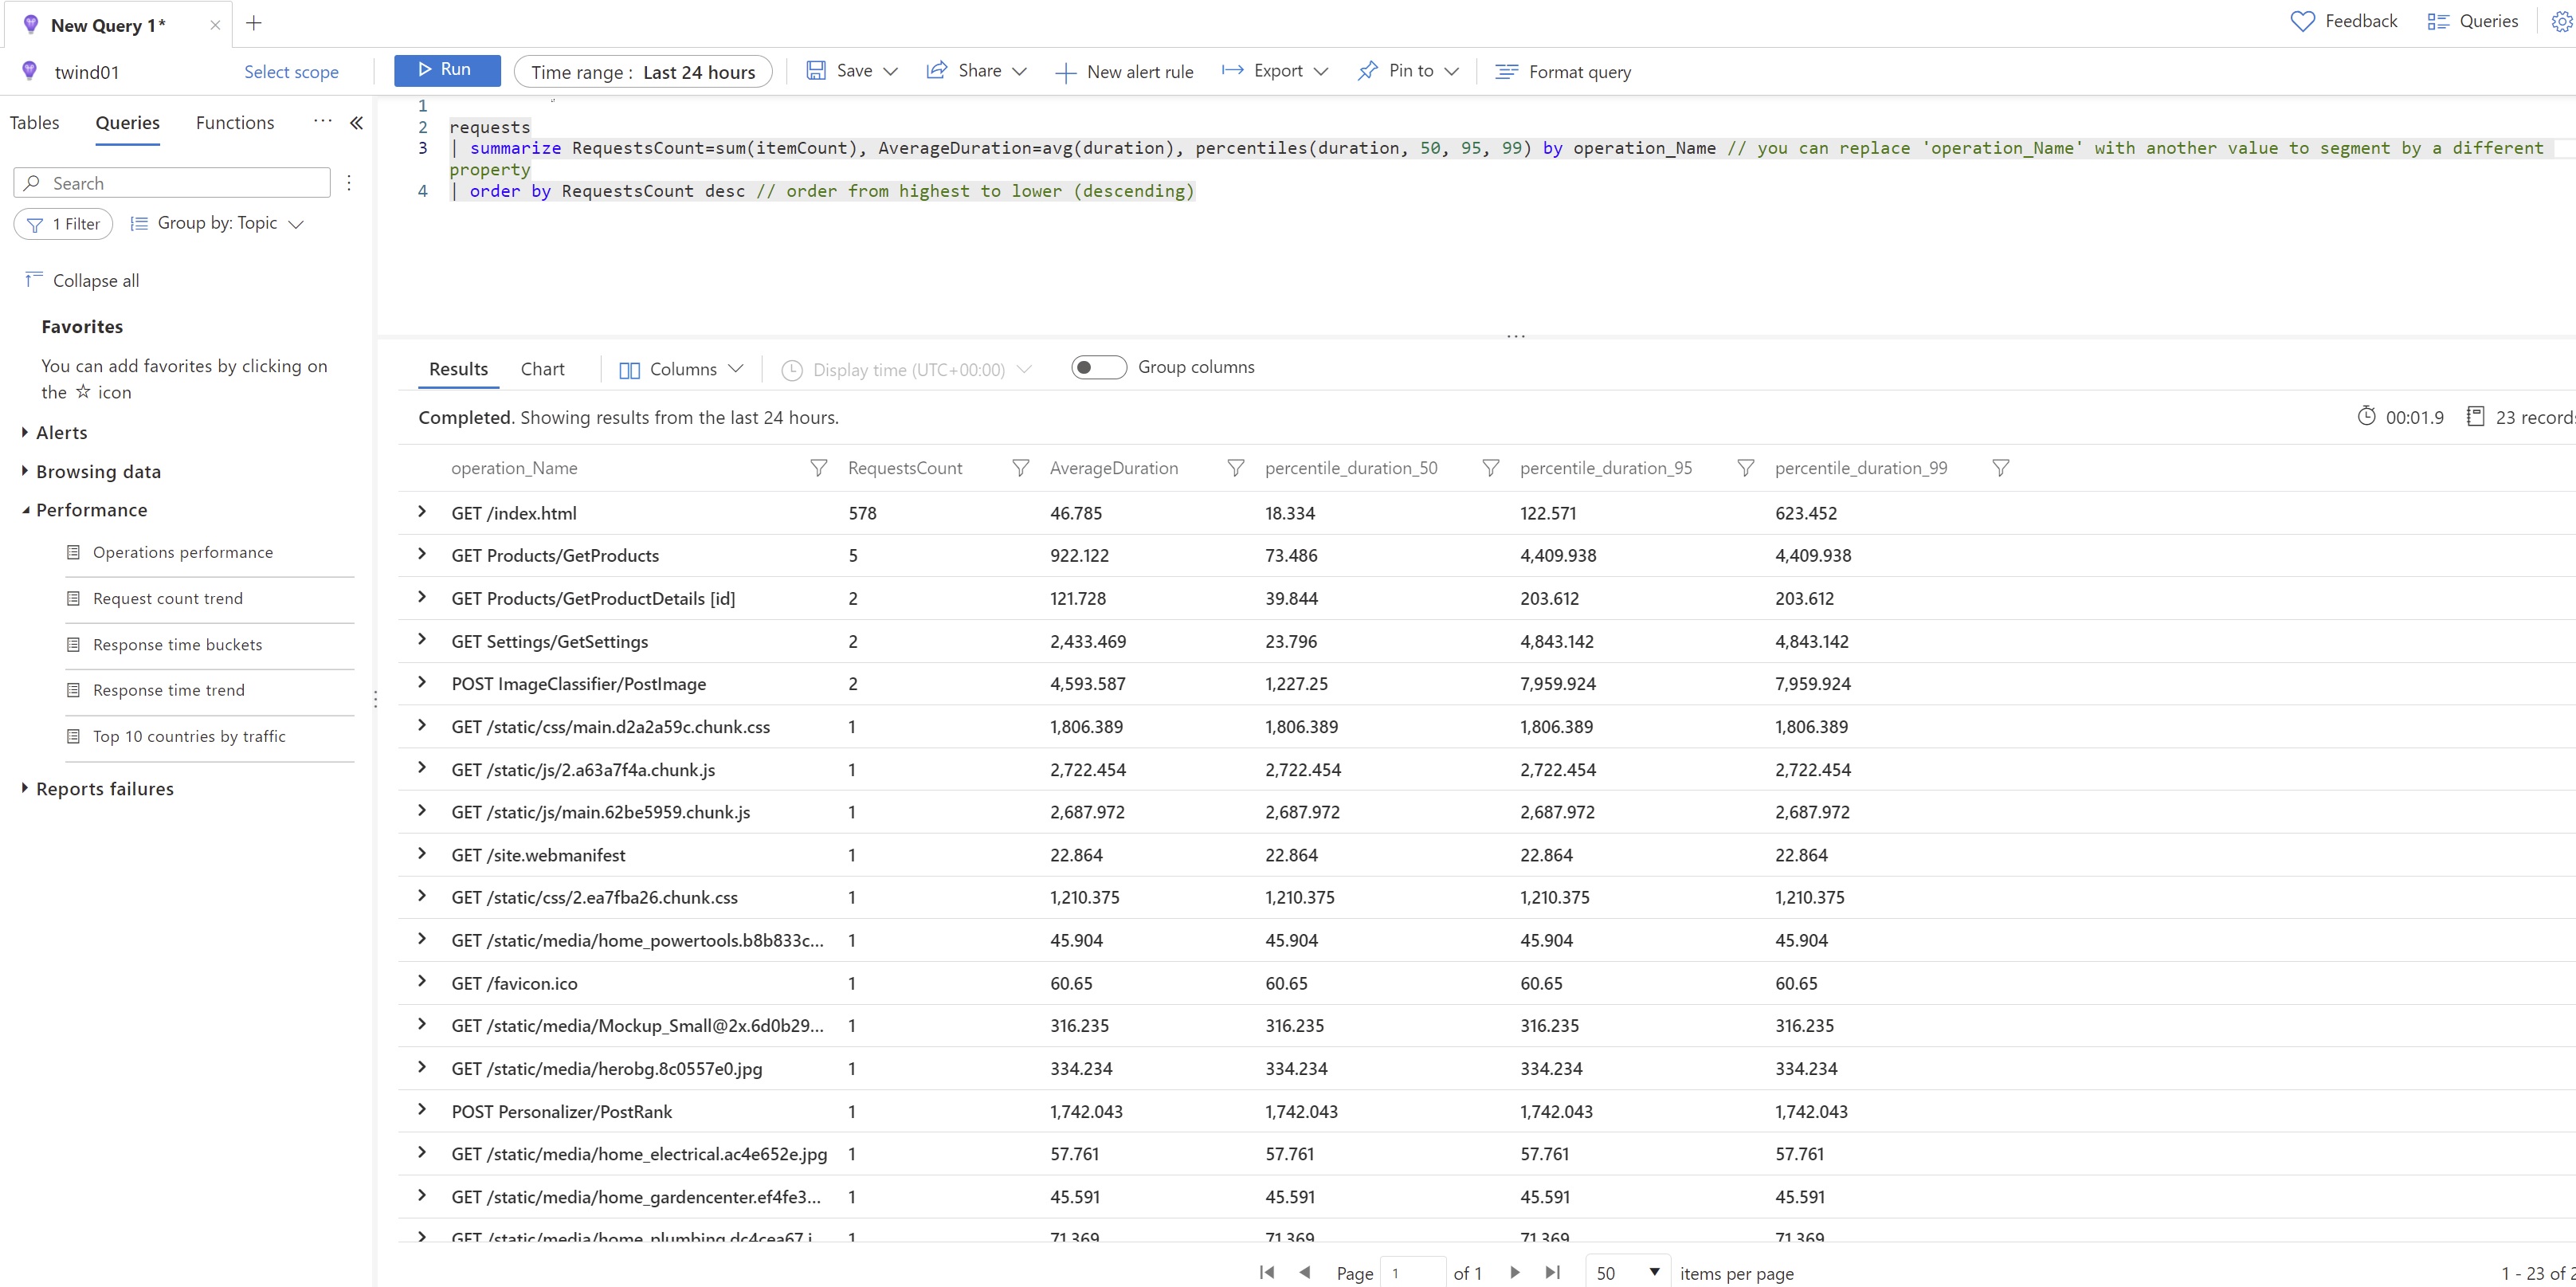
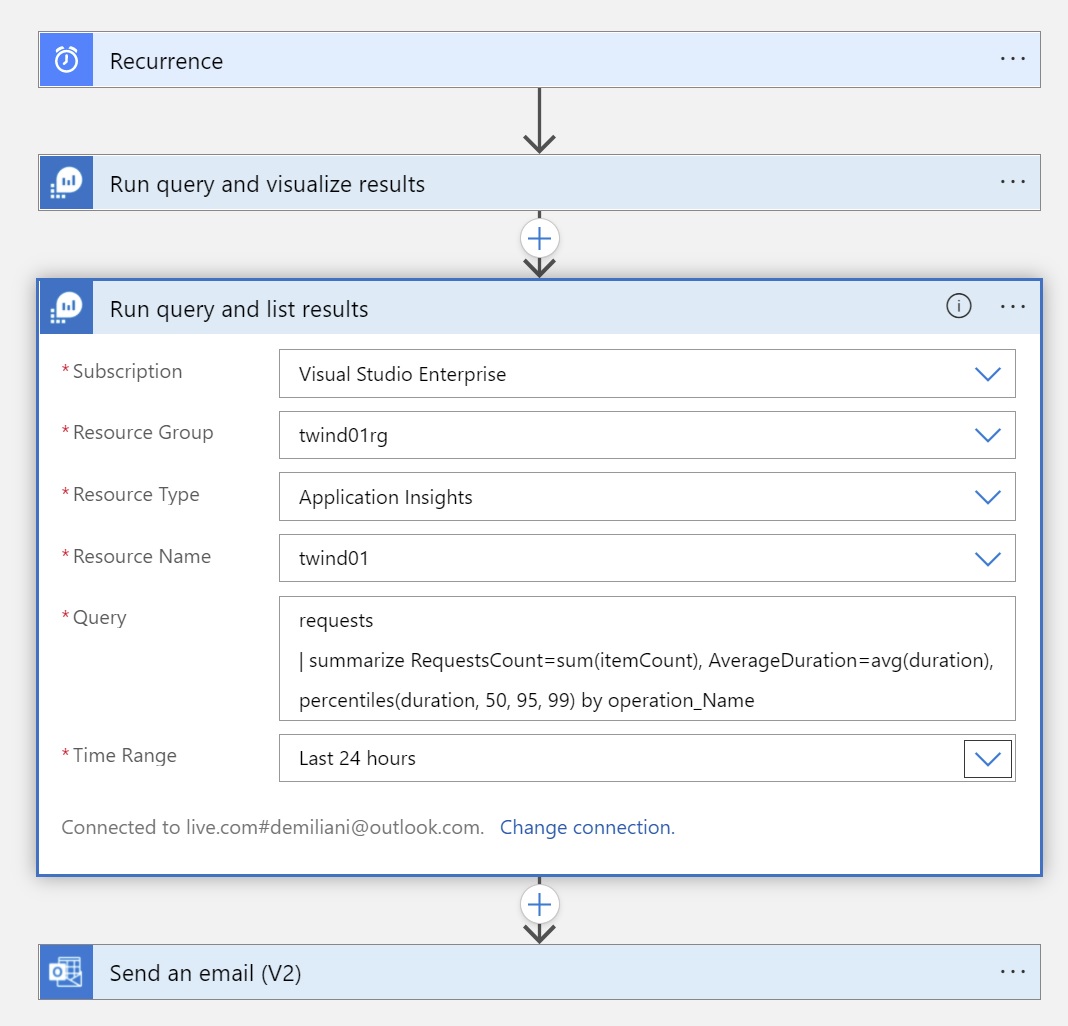
We can also use Log Analytics in order to inspect the website’s telemetry data. For example, with the following KQL query I can create a chart that shows the request count during the day (in order to know when my B2B site is frequently accessed and what are the critical endpoints):
requests
| summarize RequestsCount=sum(itemCount), AverageDuration=avg(duration), percentiles(duration, 50, 95, 99) by operation_Name
| order by RequestsCount desc
and I can also create the following KQL query for monitoring the average response time of the B2B website during the day:
requests
| where timestamp > ago(24h)
| summarize avgRequestDuration=avg(duration) by bin(timestamp, 10m) // use a time grain of 10 minutes
| render timechart

We can use the Application Map feature in order to discover performance bottlenecks or failure hotspots across all components of our distributed application:

In this map, each node represents an application component or its dependencies and it has health KPI and alerts status. You can click through from any component to more detailed diagnostics, such as Application Insights events:

When logged as an admin to this B2B website, I have the possibility to manage the items in the shop and upload photos for the items.
When I click on the Upload new photo feature, the website returns me an error:

With Application Insights, I can check the Failures and discover the logged exception:
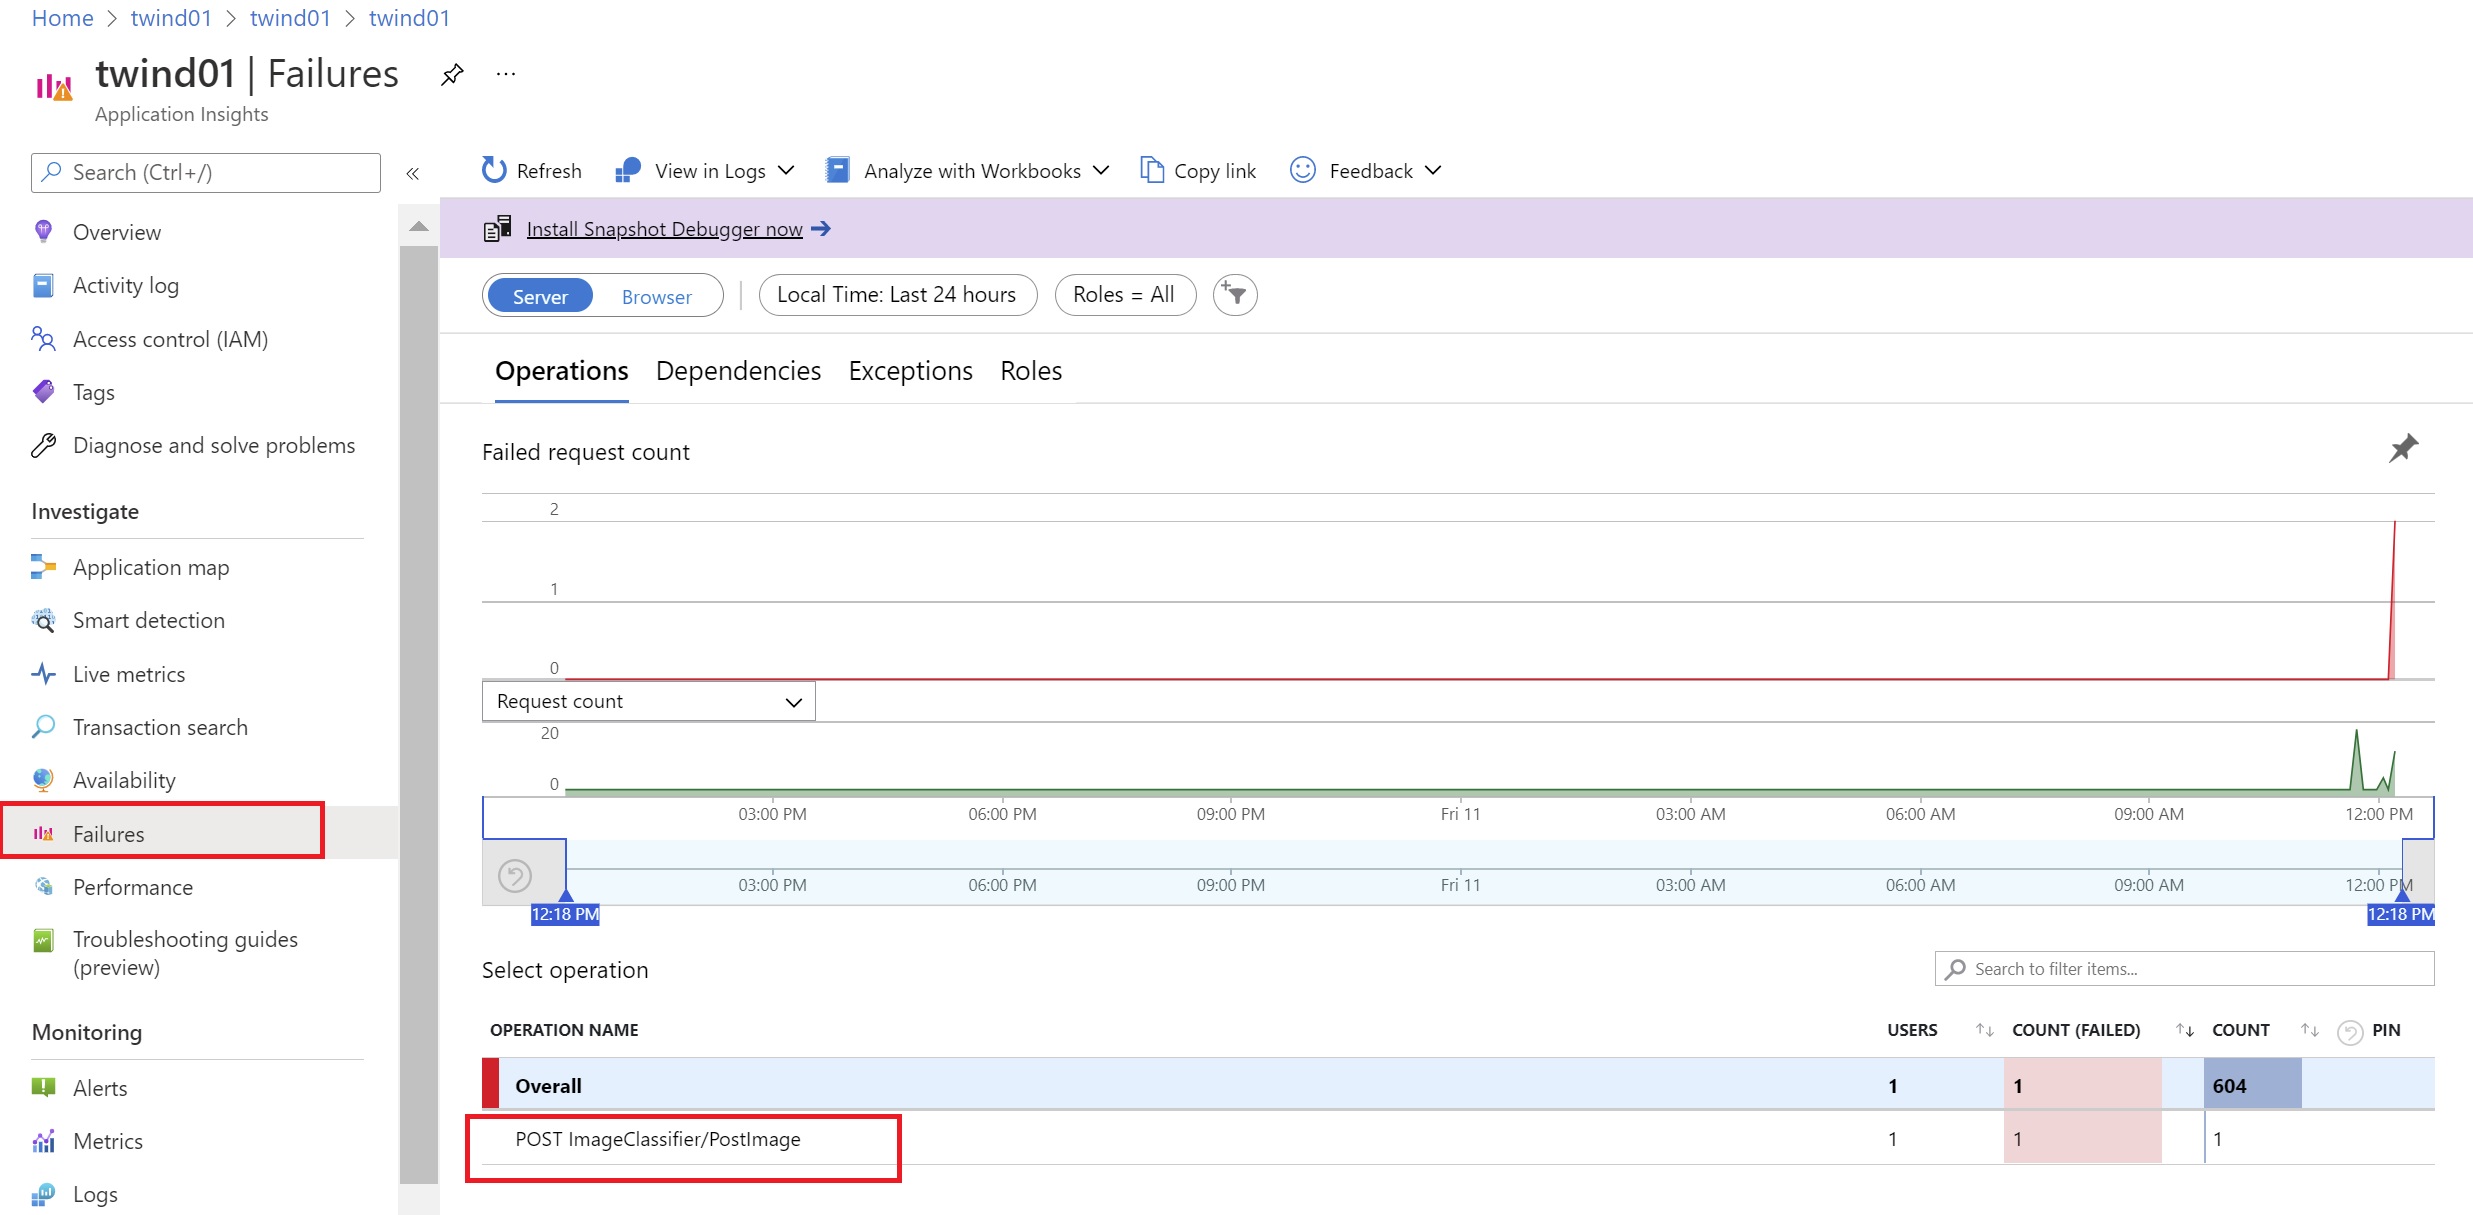
Here I can see that the exception is caused by a POST request to the ImageClassifier/PostImage method in my website code.
I can now click on the Exception and then I can discover the entire stack trace and all details related to the exception itself:
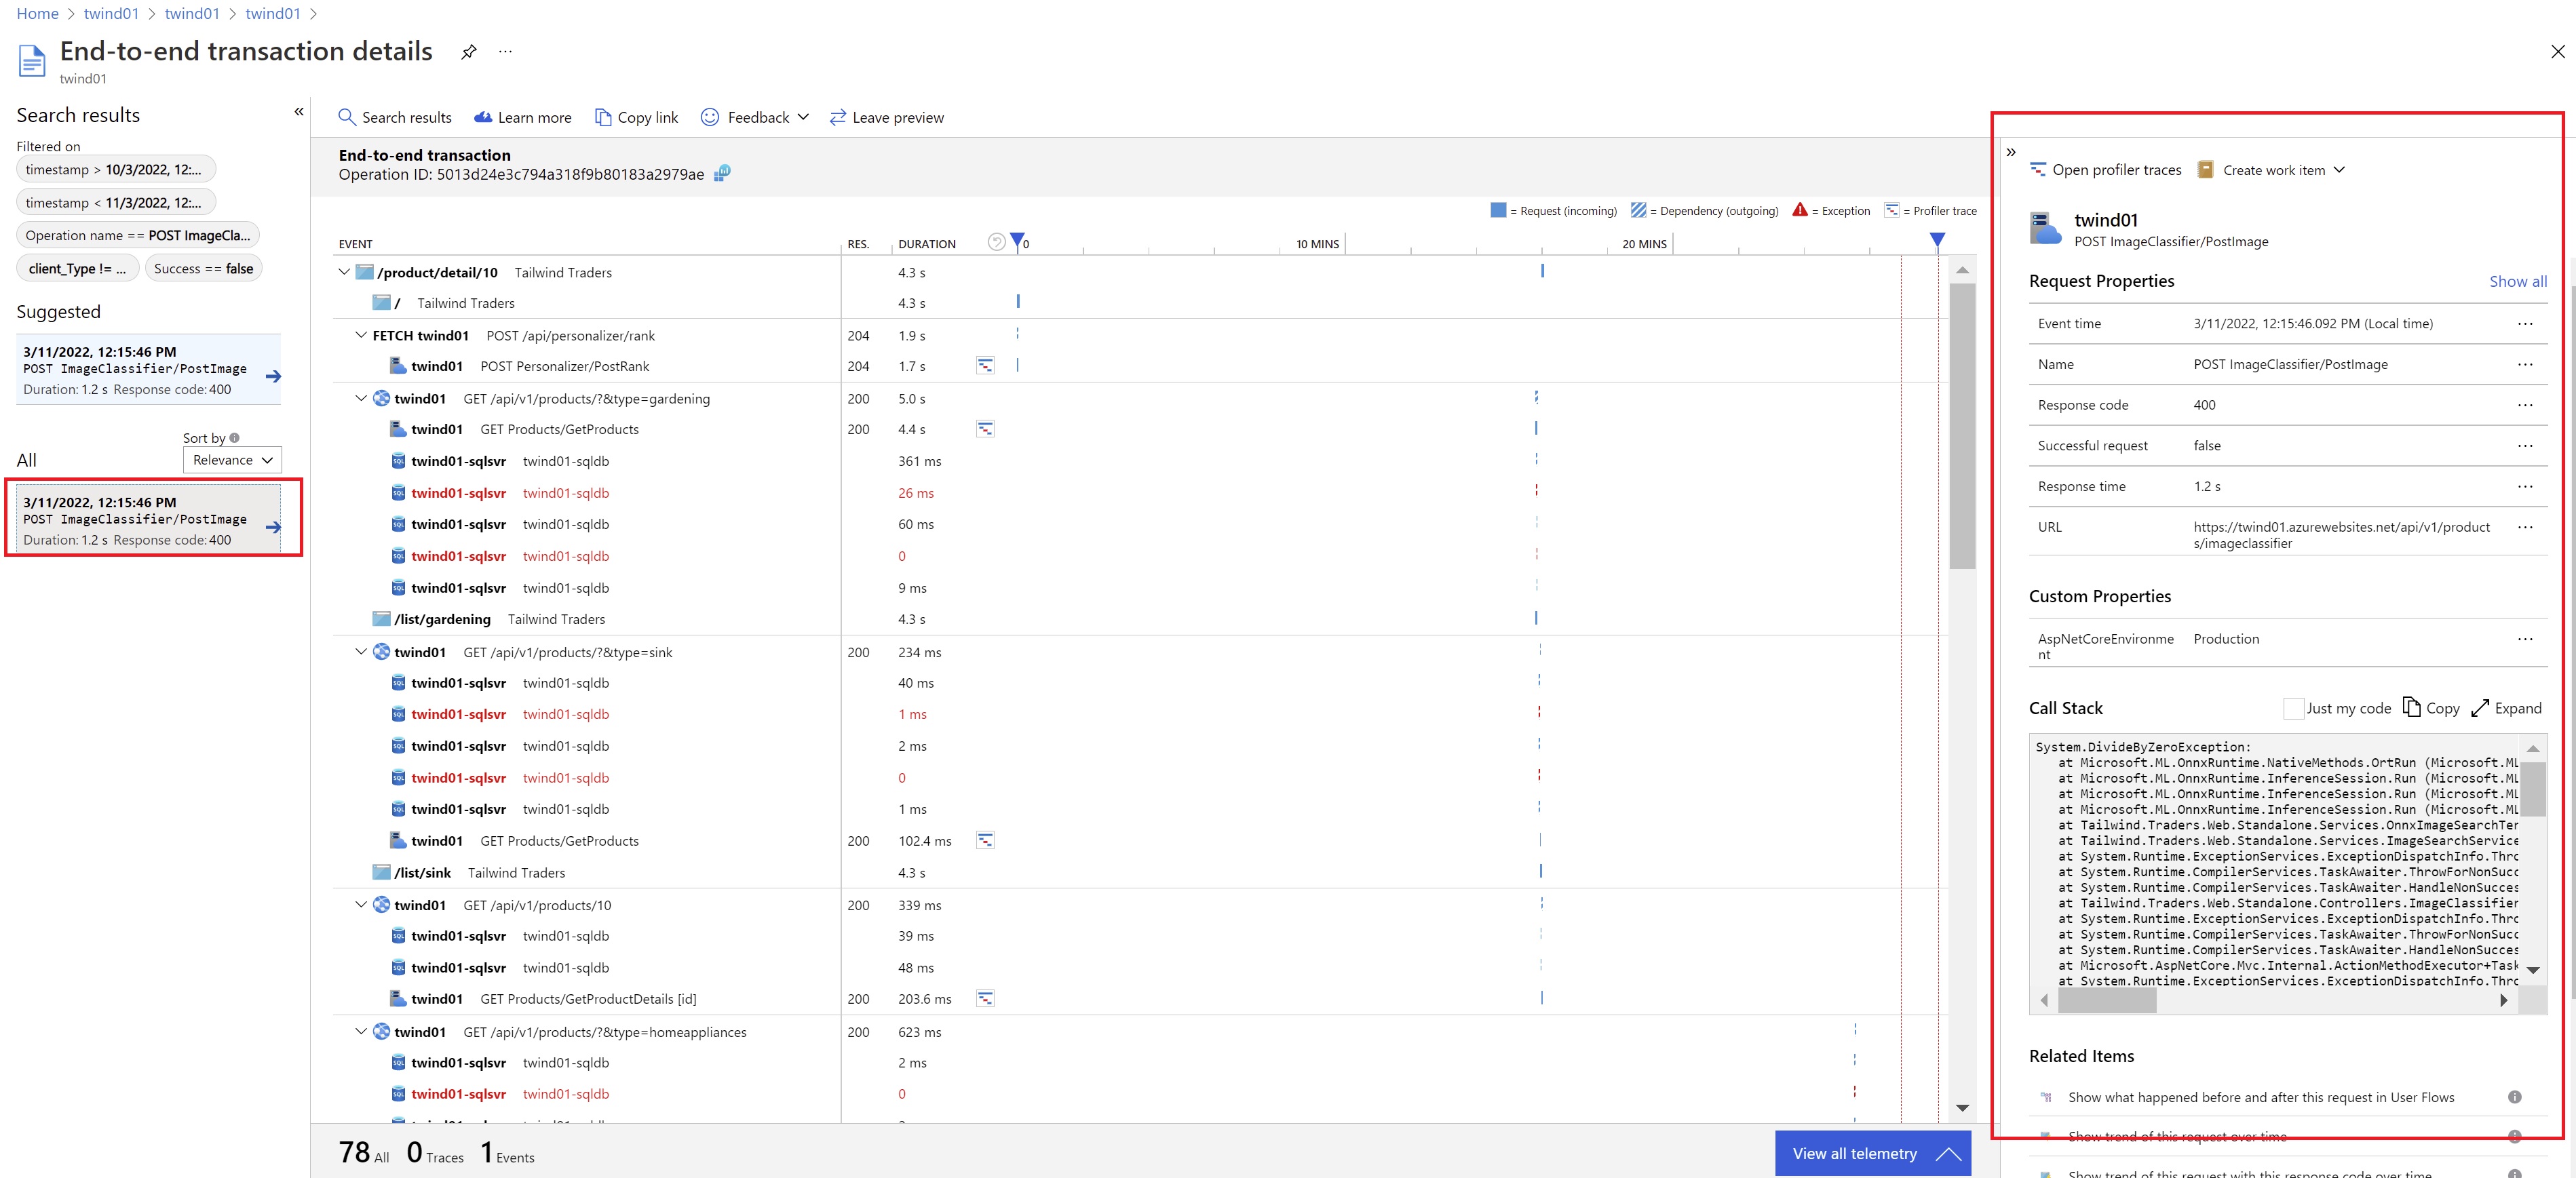
Here for example you can see that I have a division by zero in my website code that causes the error and that should be fixed.
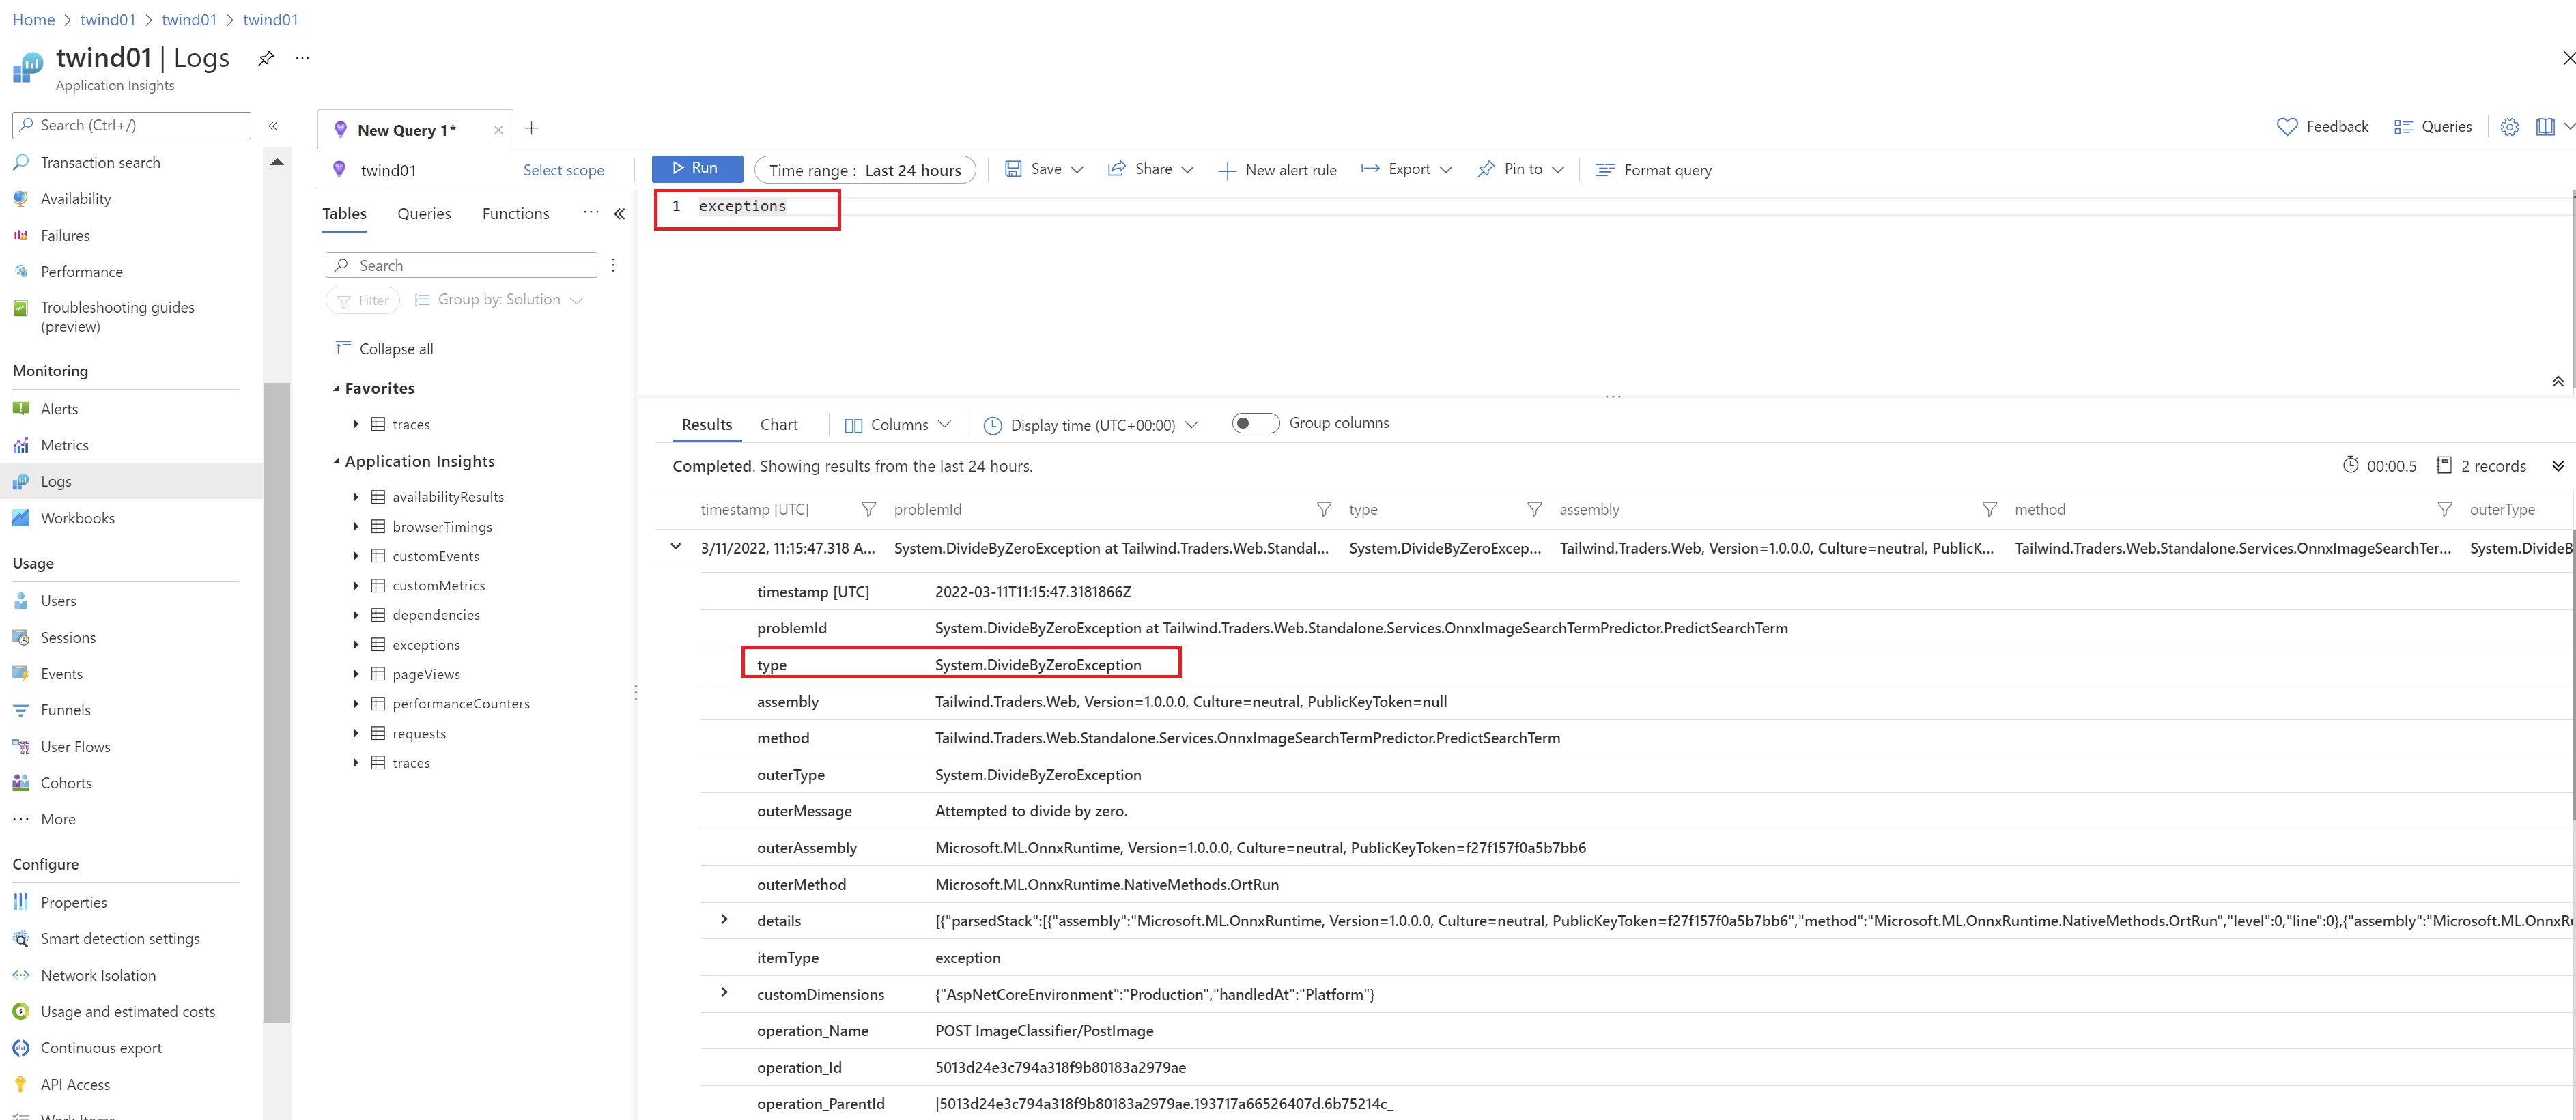
We can also open Log Analytics and perform KQL queries inside our telemetry store in order to inspect the entire telemetry. For example, If I want to inspect exceptions, we can do something like the following:
I think that you can clearly understand how powerful are Azure Monitor and Application Insights in order to monitor your cloud resources at scale.
But what could be a possible “limitation” here? You need to access the Azure Portal in order to retrieve the telemetry data you need. In many scenarios, the IT department of your customers could ask you if they can be “proactively” informed about certain metrics without accessing the Azure Portal at all. And if you want to provide visibility on telemetry data also to your consultants?
In summary, the goal here is: can I periodically receive a report about some metrics registered into Application Insights from my monitored resources?
Telemetry at your fingertips
The idea to solve this request is to create some serverless tasks that periodically execute some KQL queries inside our telemetry store and send us the results automatically in a tabular format.
The output could be an email with an HTML body of the results of the inspection or an email with a CSV file containg the telemetry details as attachment.
Imagine that I want to be notified every day about all the requests that my B2B website receives during the day (see KQL query above).
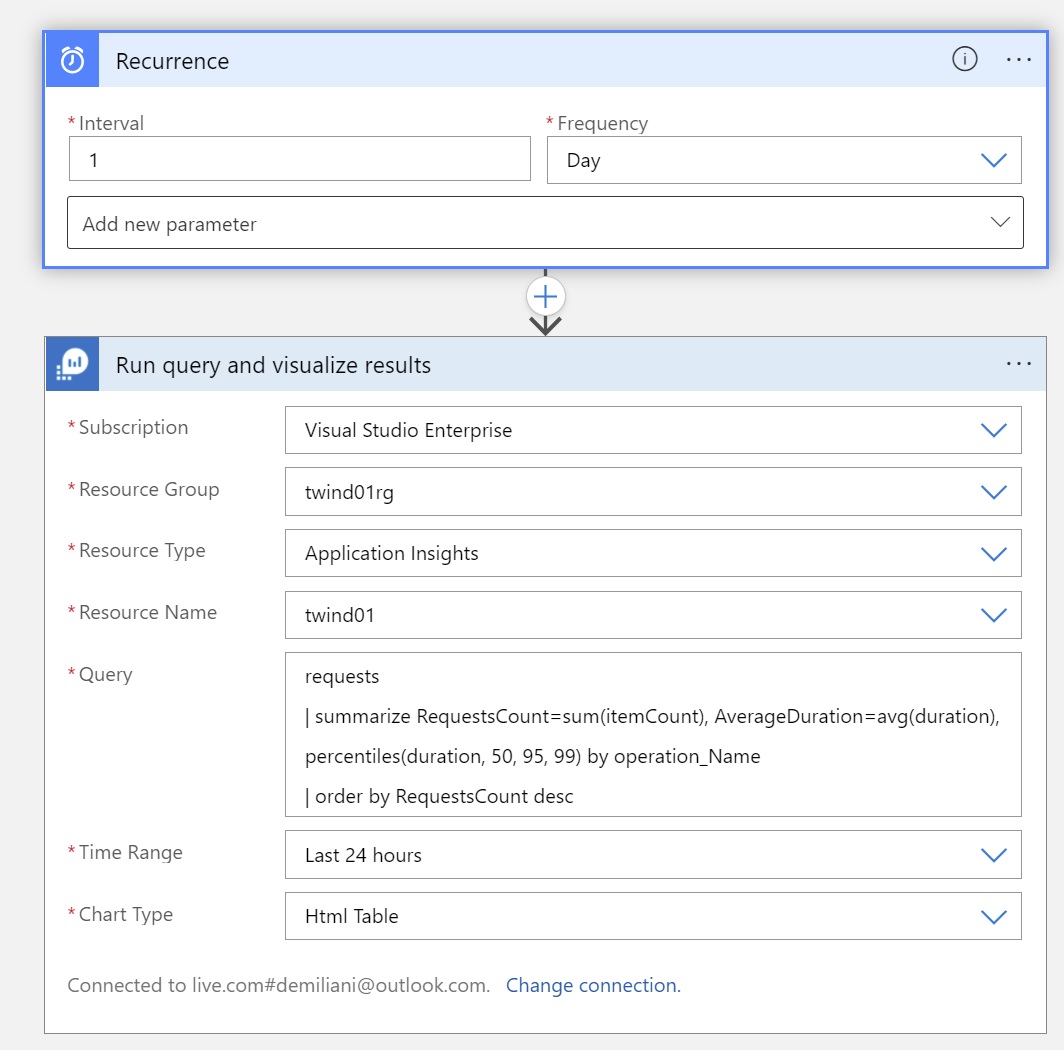
To solve this, we can create a timer-triggered workflow by using Azure Logic Apps.
Open the Azure Portal and create a new Azure Logic App. We need to use the Recurrence action (in order to have a timer-triggered workflow) and also the Run query and visualize results action under the Azure Monitor Logs connector.
In the Run query and visualize results action you need to specify the following parameters:
- Subscription: select the Subscription of your Log Analytics Workspace
- Resource Group: select the Log Analytics Resource Group
- Resource Type: select Application Insights
- Resource Name: select your Azure Application Insights instance name
- Query: insert the KQL Log Analytics query that you want to use for retrieving the telemetry data
- Time range: select the time range for the query
- Chart Type: select HTML Table (in order to have the output in a tabular form)
This part of the workflow will be defined as follows:
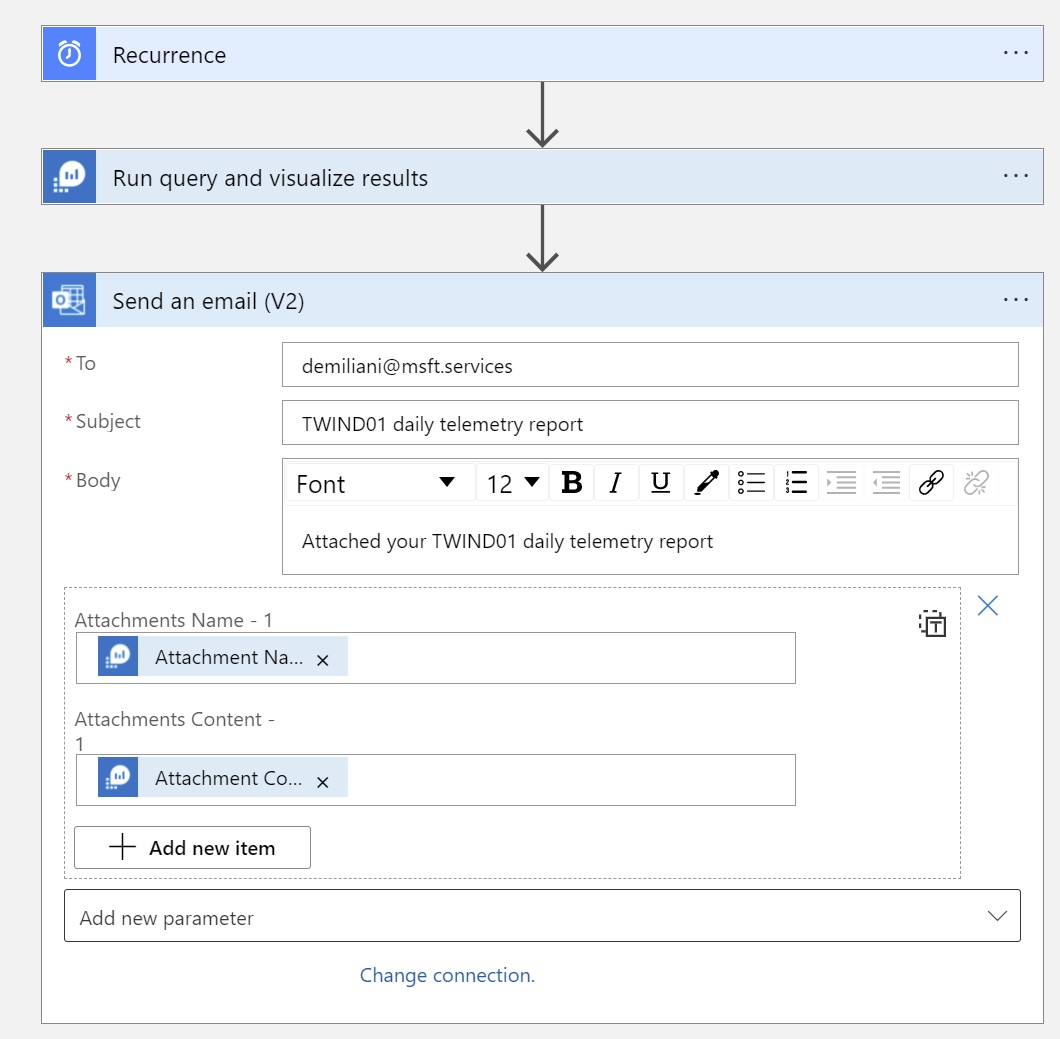
Then we can add an action for sending the report (output of the previous action) as attachment of a mail message (using the Outlook connector):
Save the workflow and run it. What is the result?
I have a new email in my mailbox:

and if I open the attachment, here is the report:

The telemetry reaches you… no interaction with the Azure Portal now!
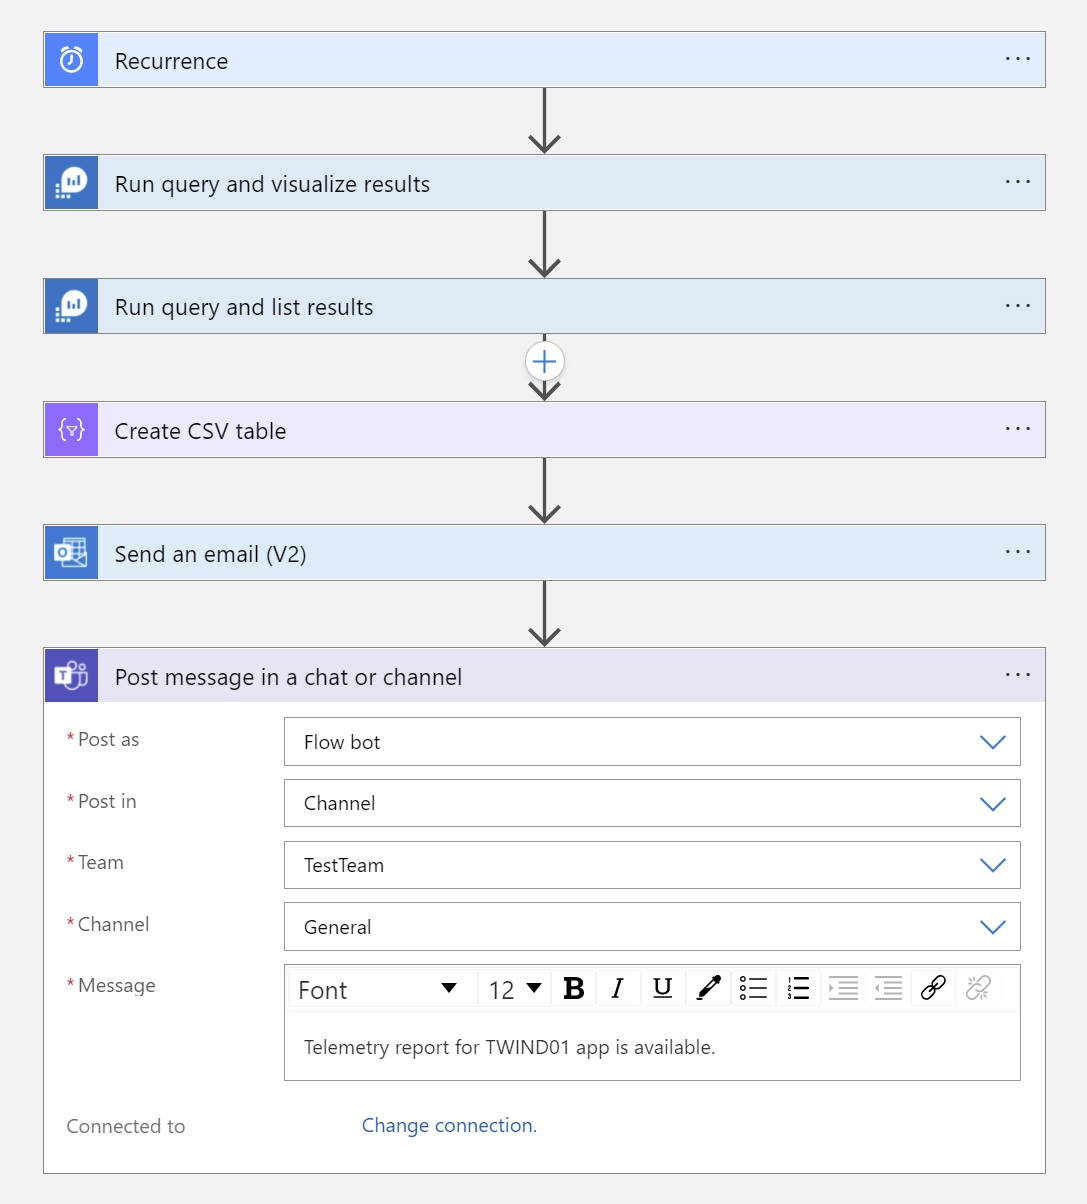
You can also improve the workflow and modify it in order to have also a CSV report in your mailbox. For this, add a new action from the Azure Monitor connector called Run query and list results and configure it as follows:
Now add a Create CSV Table action and take the value from the previous action as follows:
and then modify the Send an email (V2) action by adding a new attachment that takes the output from the newly added Azure Monitor action as follows:

Now save the flow and execute it again:

In your mailbox you will have something more now:
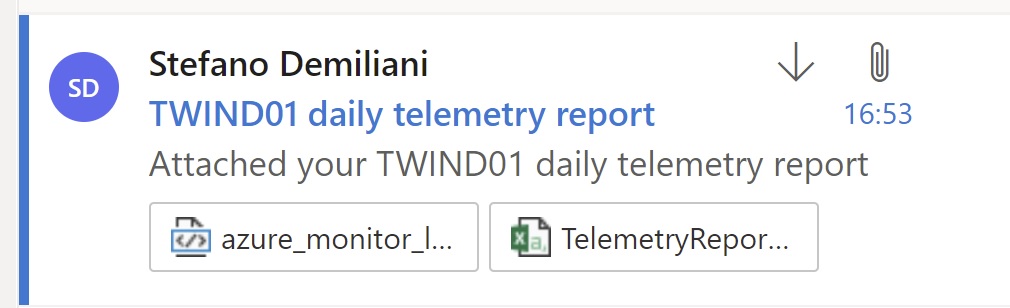
Now you have an email with two attachments: an HTML report and a CSV file with the telemetry details:

How cool is that? Telemetry reaches you now… 🙂
You can obviously enhance the workflow and for example modify it in order to send also a message to a Teams channel where your IT admins lives and more… it’s up to you now:
If you want to start improving your user’s telemetry experience, start thinking on something about that, this could help on increasing confidential on analyzing telemetry data a lot (and this should be a mandatory practice in a cloud world).
