When working with Dynamics 365 Business Central (but also on Azure applications in general) it’s a best and recommended practice to send telemetry data to the Azure Application Insights service for centralize monitoring. I’ve talked about that in the past here.
Have you ever received the request to monitor some Azure Resources directly from inside Dynamics 365 Business Central and be able to collect metrics from Azure for statistical purposes inside your ERP? Yes, I have also this request on my “strange ideas” collection and this post describes a possible solution for this absolutely uncommon task.
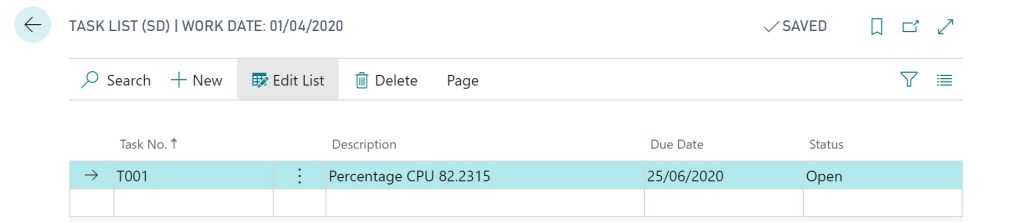
The request here is to monitor the usage of an Azure Virtual Machine (but you can extend this scenario to every resource on Azure) and when this usage is over a defined threshold, we want to collect this data inside Dynamics 365 Business Central. To be simple, in this scenario every time my monitored Azure Virtual Machine CPU goes over 80%, I want to open a task inside my ERP (creation of a record in a custom table). For reaching our goal we need to create an alert rule for the Azure resource that we want to monitor and this alert rule must trigger an API exposed by Dynamics 365 Business Central (in particular, a custom API because the Task table where I want to save my data is a custom table).
The needed steps here are the following:
- Create an alert rule on the Azure Resource
- Configure the alert rule to trigger an Azure Function or an Azure Logic app
- Create an Azure Function or an Azure Logic app that receives the incoming request and calls the custom API exposed by Dynamics 365 Business Central
In this post I don’t want to describe how to publish a custom API with Dynamics 365 Business Central (I assume that you’ve previously done this by creating a Task table and publishing an API page over this table). In this post I want also to use the “low code” approach, so we’ll see how to use an Azure Logic app instead of an Azure Function.
When you create an alert for an Azure resource with Azure Monitor, you can activate the common alert schema definitions for webhooks, Azure Logic Apps, Azure Functions, and Azure Automation runbooks. Any alert instance describes the resource that was affected and the cause of the alert. These instances are described in the common schema in the following sections:
- Essentials: A set of standardized fields, common across all alert types, which describe what resource the alert is on, along with additional common alert metadata (for example, severity or description).
- Alert context: A set of fields that describes the cause of the alert, with fields that vary based on the alert type. For example, a metric alert includes fields like the metric name and metric value in the alert context, whereas an activity log alert has information about the event that generated the alert.
A platform alert for the Percentage CPU metric has the following JSON representation:
{
  "alertContext": {
  "properties": null,
  "conditionType": "SingleResourceMultipleMetricCriteria",
  "condition": {
    "windowSize": "PT5M",
    "allOf": [
    {
      "metricName": "Percentage CPU",
      "metricNamespace": "Microsoft.Compute/virtualMachines",
      "operator": "GreaterThan",
      "threshold": "25",
      "timeAggregation": "Average",
      "dimensions": [
        {
          "name": "ResourceId",
          "value": "3efad9dc-3d50-4eac-9c87-8b3fd6f97e4e"
        }
      ],
      "metricValue": 31.1105
    }
  ],
  "windowStartTime": "2019-03-22T13:40:03.064Z",
  "windowEndTime": "2019-03-22T13:45:03.064Z"
  }
 }
}
More informations about the alert schema can be found at the following link: https://docs.microsoft.com/en-us/azure/azure-monitor/platform/alerts-common-schema-definitions
Let’s start by creating the Azure Logic app. From the Azure Portal, create a new Azure Logic App and select the When an HTTP request is received template (this creates for you an HTTP triggered Logic App). Then click on the Use sample payload to generate schema in order to set the request body JSON schema:
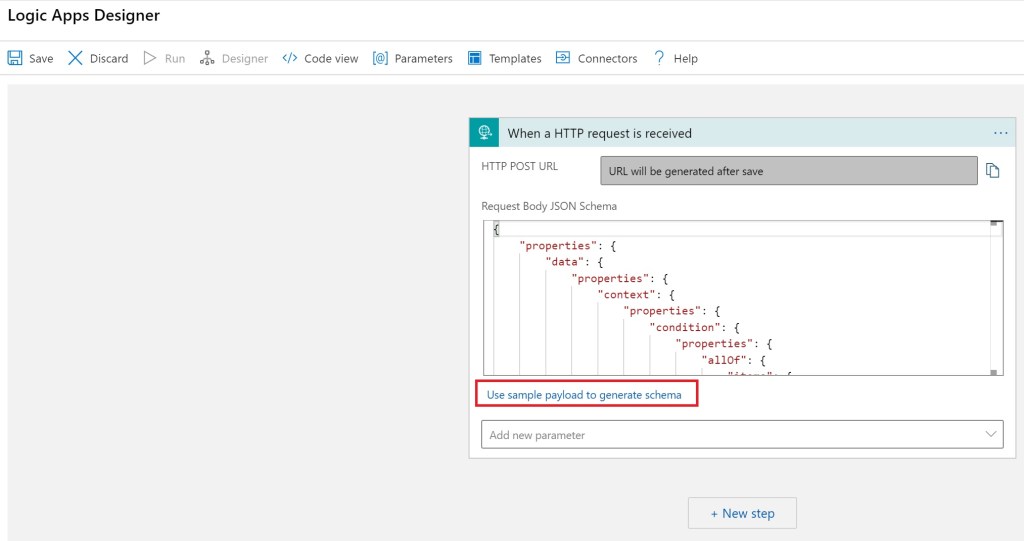
In the sample schema window, you can directly post the JSON schema that you can see in the above provided link on MSDN, but you can also use the Azure Monitor Metric Alert Handler template that creates the same task with the payload automatically loaded for you:

This task retrieves the alert details sent by Azure Monitor (we’ll talk about this later) and now we need to call our Dynamics 365 Business Central API for storing the data we want.
My custom Task API has the following endpoint:
https://api.businesscentral.dynamics.com/v2.0/TENANTID/sandbox/api/sd/customapi/v1.0/companies(COMPANYID)/tasks
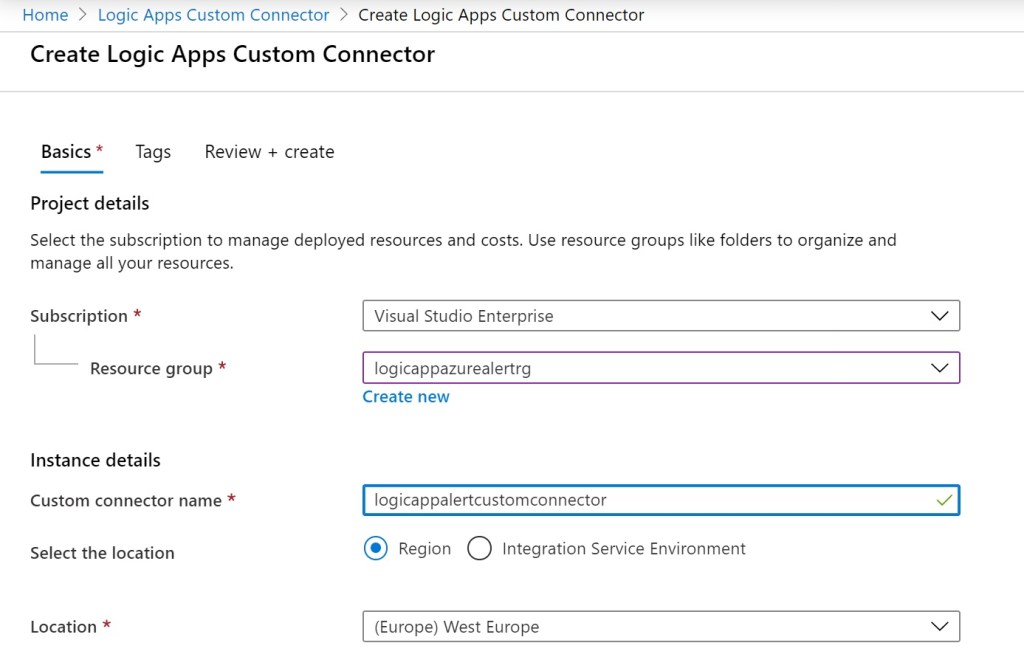
For doing that, we cannot use the standard Dynamics 365 Business Central connector but we need to create a custom connector. We can do that directly from the Azure Portal:
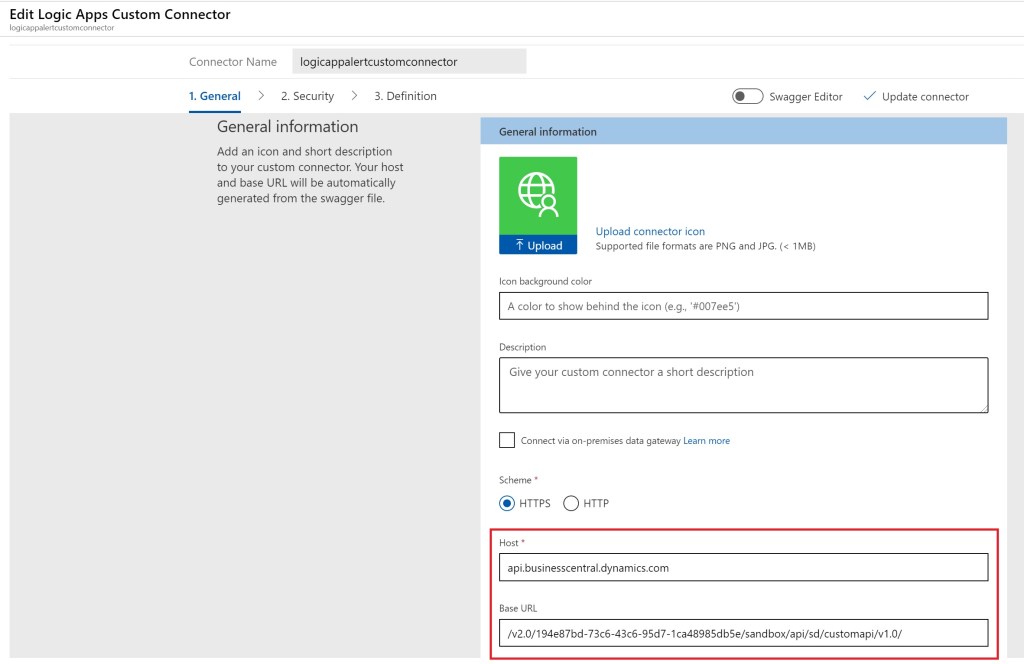
In the custom connector definition, we need to specify the host and the Base URL as follows:
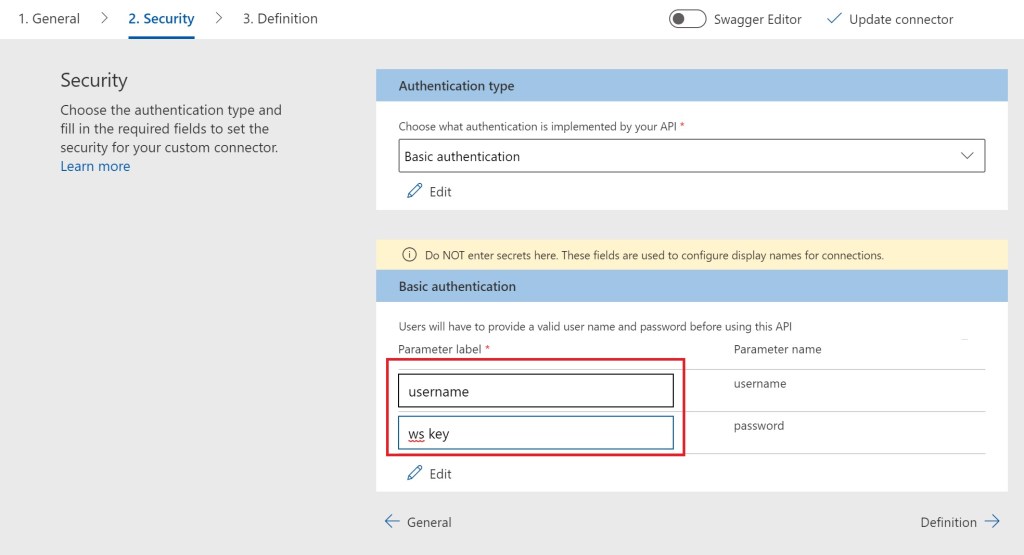
In the Security section we need to specify the authentication for the connector. For simplicity here I’m using Basic Authentication and for supporting this I need to create two parameters for storing username and web service access key (please don’t provide credentials here):
Then we need to create the Actions that this connector supports. Here I need to call my Dynamics 365 Business Central custom API for inserting a new Task record, so I need to perform a POST request. We can create the action in the following way:
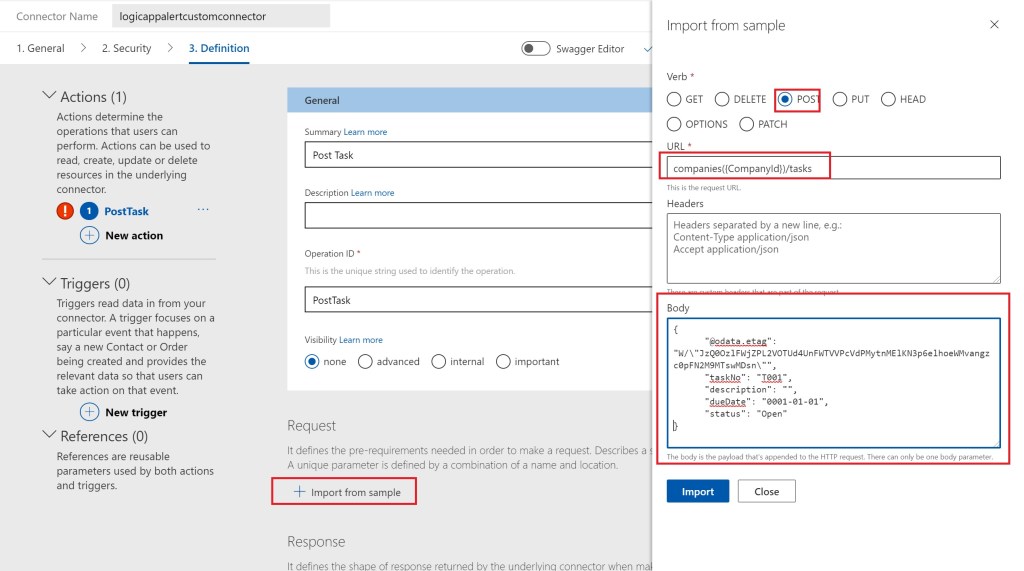
Here, I’m creating an action called PostTask that performs a POST http request to the provided url. As you can see, I’m passing the company ID as a request url parameter to this method. In the Body section of the method definition I’m pasting the JSON body of my API (as requested by the POST).
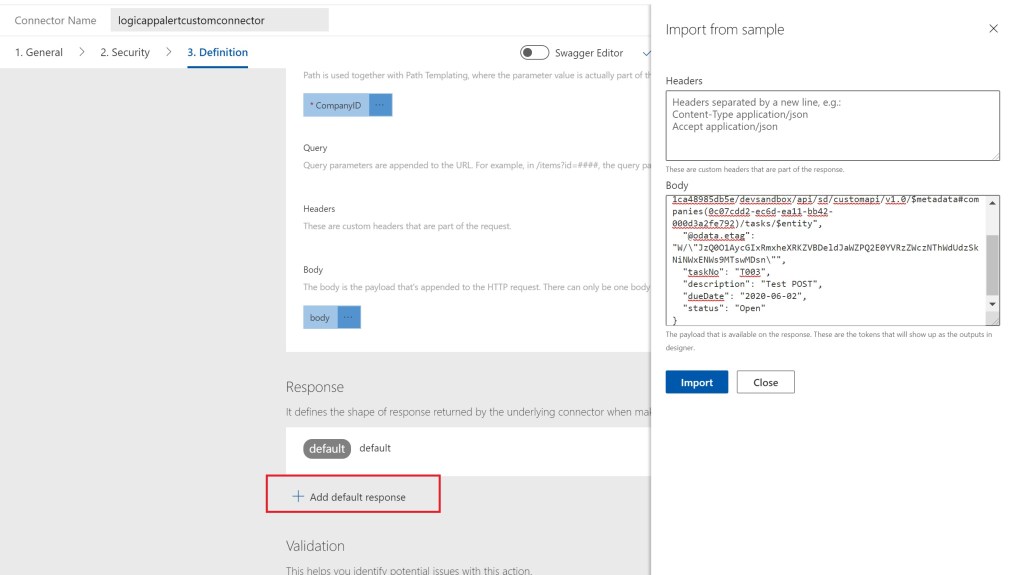
Now we need to create a response, and for the response I can simply copy the response that my API send me when I try to insert a record :

The response definition will be as follows:
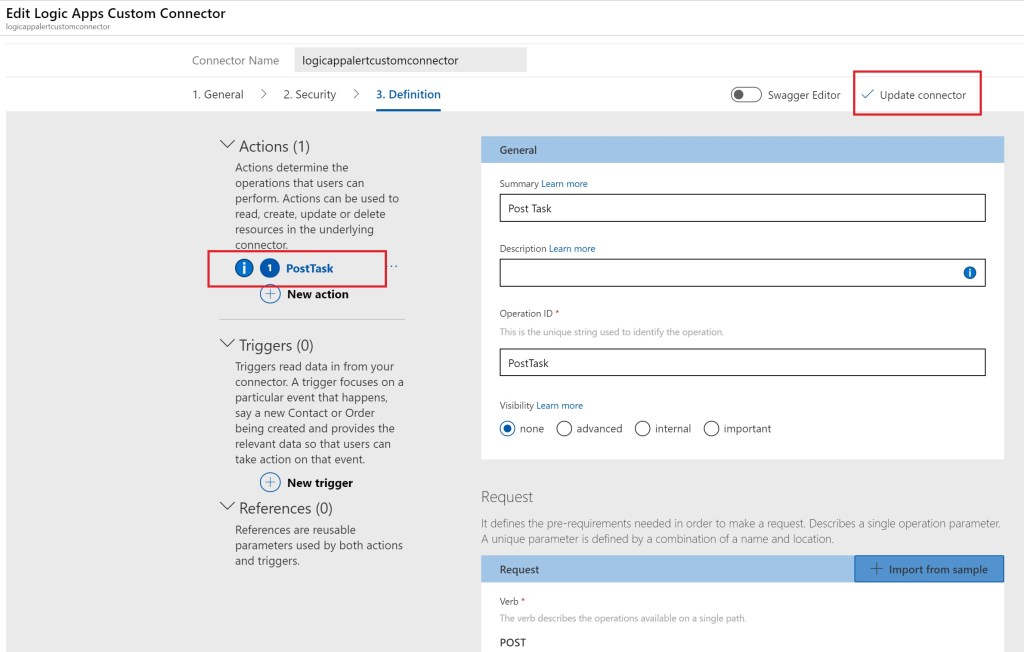
Now our PostTask action is defined and we can click on Update connector to save our custom connector:
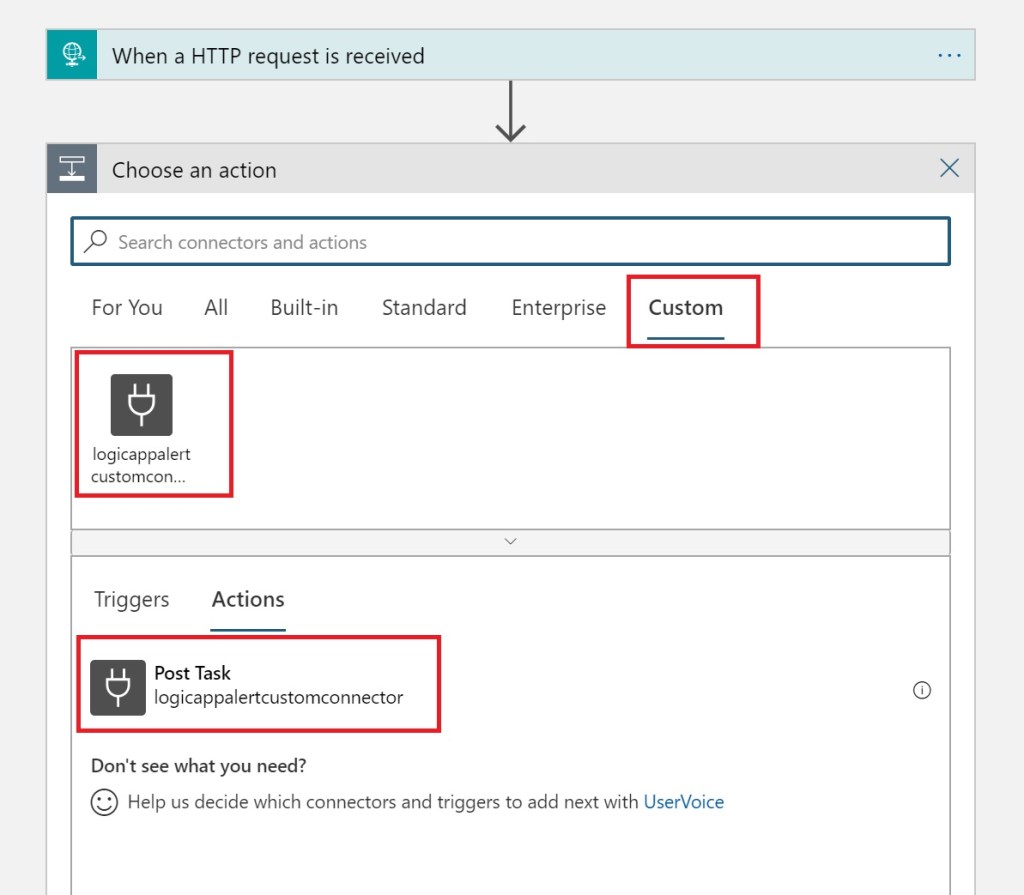
The custom connector for our Logic App is ready to be used. Go back to our Logic App Designer page and add a new action. When choosing for the action to add, select Custom and then select the custom connecotr and the relative action that we want to use (here called Post Task):
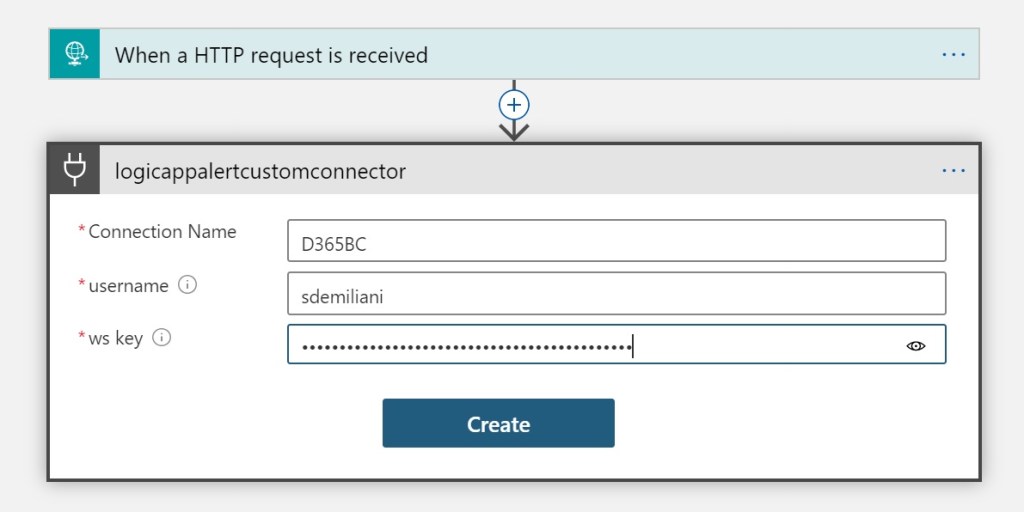
Now we need to provide the credentials for the connector (in order to be able to access our Dynamics 365 Business Central API):
and then we can insert the parameters for the Post Task action. Here I’m creating a new Task record by setting the description, dueDate and Status parameters (requested by my custom API in Dynamics 365 Business Central) with the metric values that comes from the Azure alert:

Here you can do what you want accordingly to the API you’re using (Here I’m creating a Task record but you can for example store the metric details on a table and so on).
The Logic App that receives the incoming Azure Alert and handles it is now ready. But how we can send an alert to this Logic App? We need to create a custom alert definition as follows.
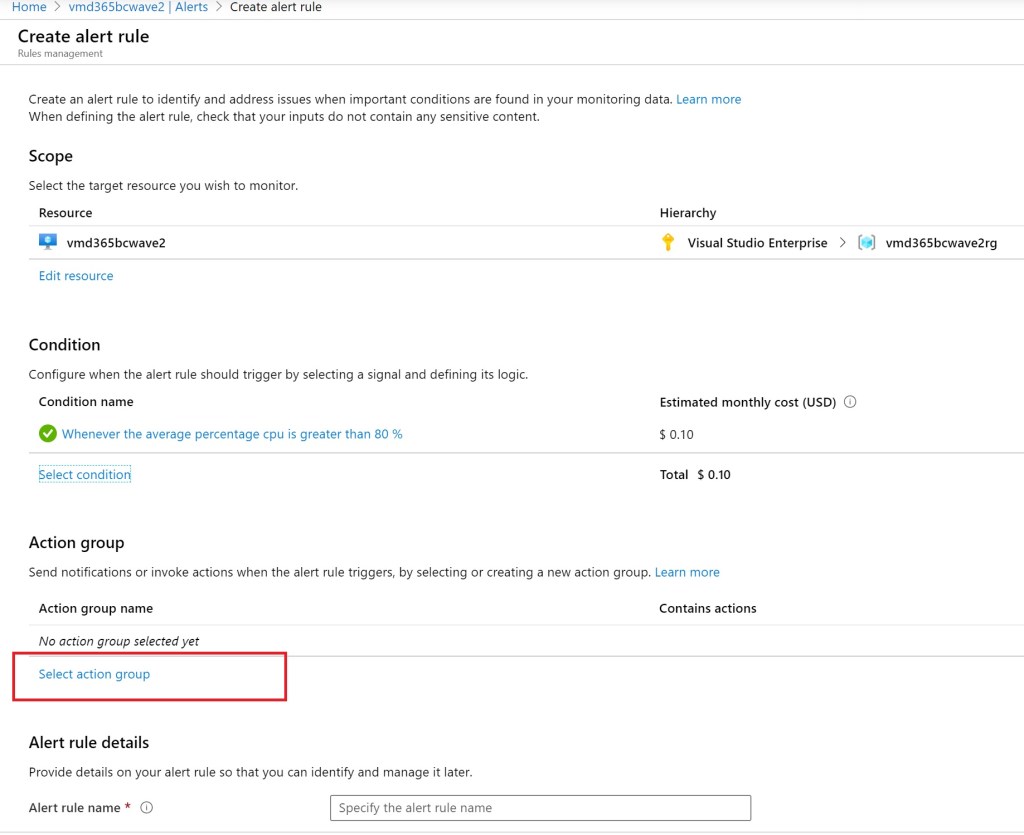
From the Azure Portal, select the resource to monitor (in my case it’s an Azure Virtual Machine), select Alerts and then create a new alert rule. Click on Select condition to configure when the alert rule will be triggered:

In this sample, my rule monitors the Percentage CPU (Platform) signal and if it’s over 80% for a period of time of 15 minutes, it triggers an alert.
After defining the condition for the alert, we need to define the Action group (what to do when the alert is triggered):
In the Create action group window, give a name for the action group and then under the Actions tab select Action type = Logic App:
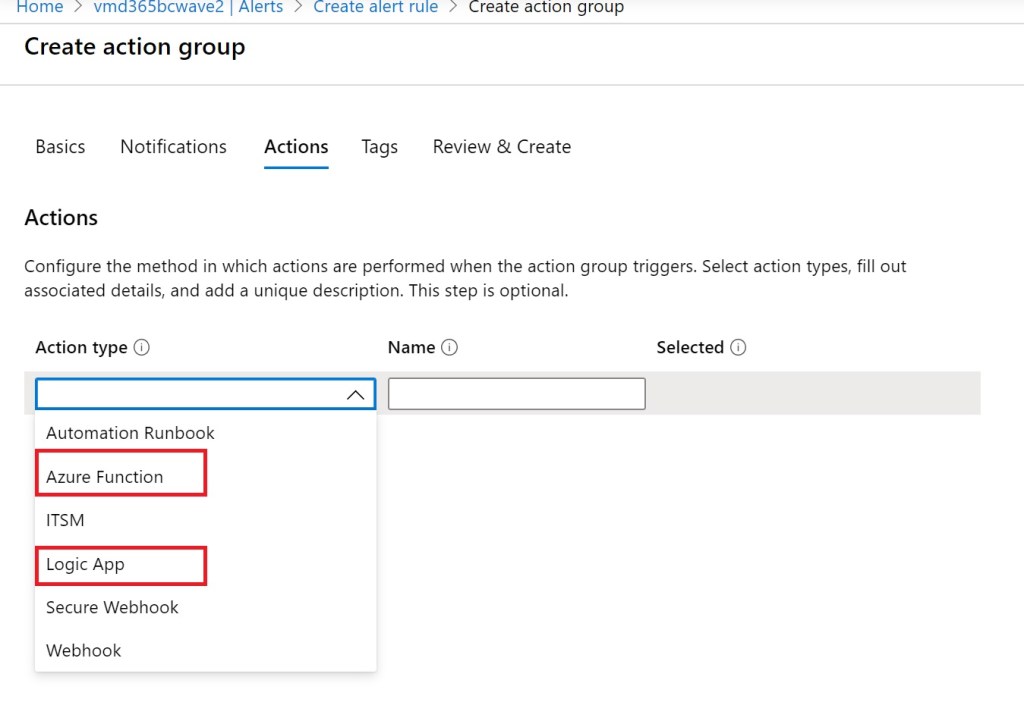
As you can see here we have also the possibility to call an Azure Function (so cool!). We’ve selected Logic App, so we need to specify what is the Logic App that must be triggered when the alert occours (I’ve selected the previously created Logic App):
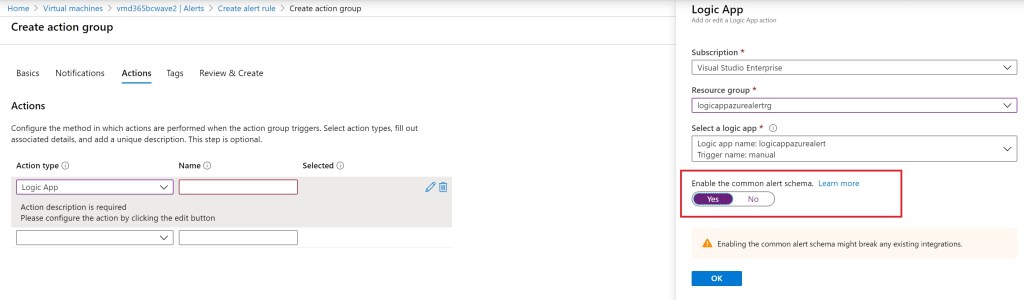
Important here is to click on the Enable the common alert schema button in order to have the common alert schema definition enabled and so receiving the template as descibed in the beginning of this post.
That’s all. We’ve created a webhooks that when the metric on our monitored Azure resource occours it send an alert to our Dynamics 365 Business Central ERP, all with a “low code” approach: