In May 2022 I wrote this post explaining the upcoming changes on the way Microsoft will start sending notifications about service incidents on Dynamics 365 Business Central.
These are very rare events but it could happen that Dynamics 365 Business Central service will be unavailable for a bit of time due to service incidents (and related activities to fix the problem). These types of unactivities are usually very short in time, but when they occours people start asking for informations on ever channel.
Dynamics 365 Business Central has a SLA defined as follows:
- Downtime: Any period of time when end users are unable to login to their instance.
- Uptime Percentage: The Uptime Percentage is calculated using the following formula:
(User Minutes – Downtime)/User Minutes * 100
where Downtime is measured in user-minutes; that is, for each Applicable Period, Downtime is the sum of the length (in minutes) of each incident that occurs during that Applicable Period multiplied by the number of users impacted by that Incident.
Service Credit:
| Uptime Percentage | Service Credit |
| < 99.9% | 25% |
| < 99% | 50% |
| < 95% | 100% |
But when a service incident occours, what can I do to know more about it?
Sources are mainly two:
- Telemetry
- Service Health Dashboard in Microsoft 365 Admin Center
I don’t want to talk about telemetry here now. You know that for me activating telemetry in a Dynamics 365 Business Central tenant is A MUST. But sometimes telemetry cannot show you details about all service incidents.
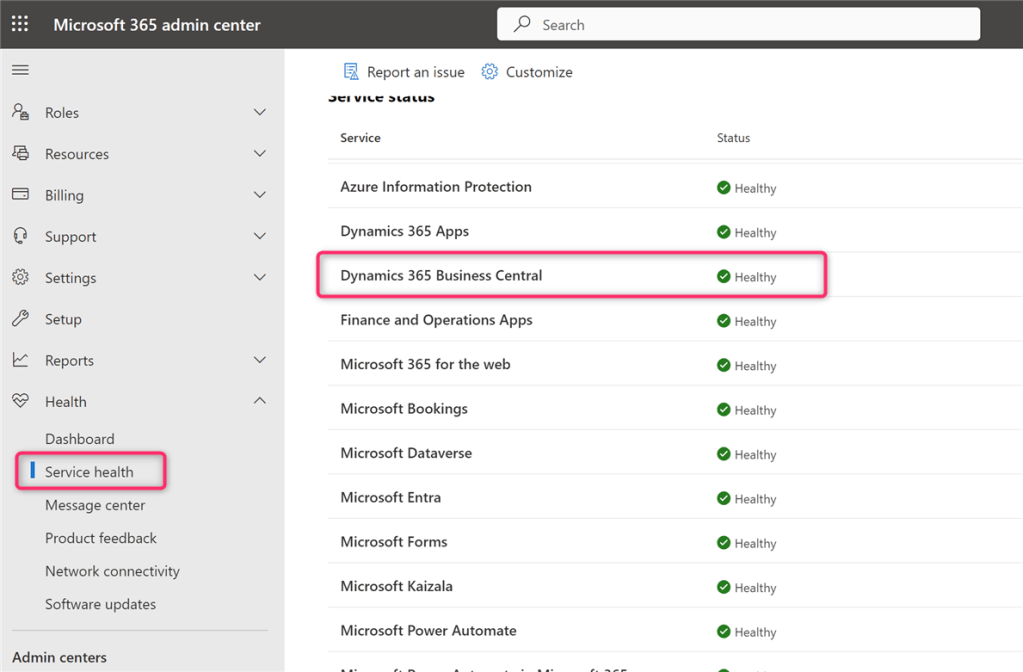
Service incidents are always communicated through Service Health Dashboard in the Microsoft 365 Admin Center portal (https://aka.ms/admincenter) and then also embedded in the Dynamics 365 Business Central Admin Center. You can access the Service Heath Dashboard from the following menu:
In this section you will find also post-incidents reports that explains what happened during a service incident and what actions will be taken to avoid that in the future (usually these details are posted within two weeks after the incident is resolved).
I recommend to activate notifications (as explained in my previous post) and always check the Service Health Dashboard to know more (this is valid not only for Dynamics 365 Business Central but also for every M365 service you have in your organization).


