Last week at BC TechDays in Belgium, I’ve received a lot of technical questions after the two sessions I’ve done. All of them was answered live, but some of these questions required also a more technical and detailed explanation and to some of you I’ve promised some blog posts in the upcoming weeks for answering. And this is the first… 🙂
During my Azure Function session, one of you asked me if it’s possible to debug a function in production. Yes, it’s possible… and here is the explanation on how to do that.
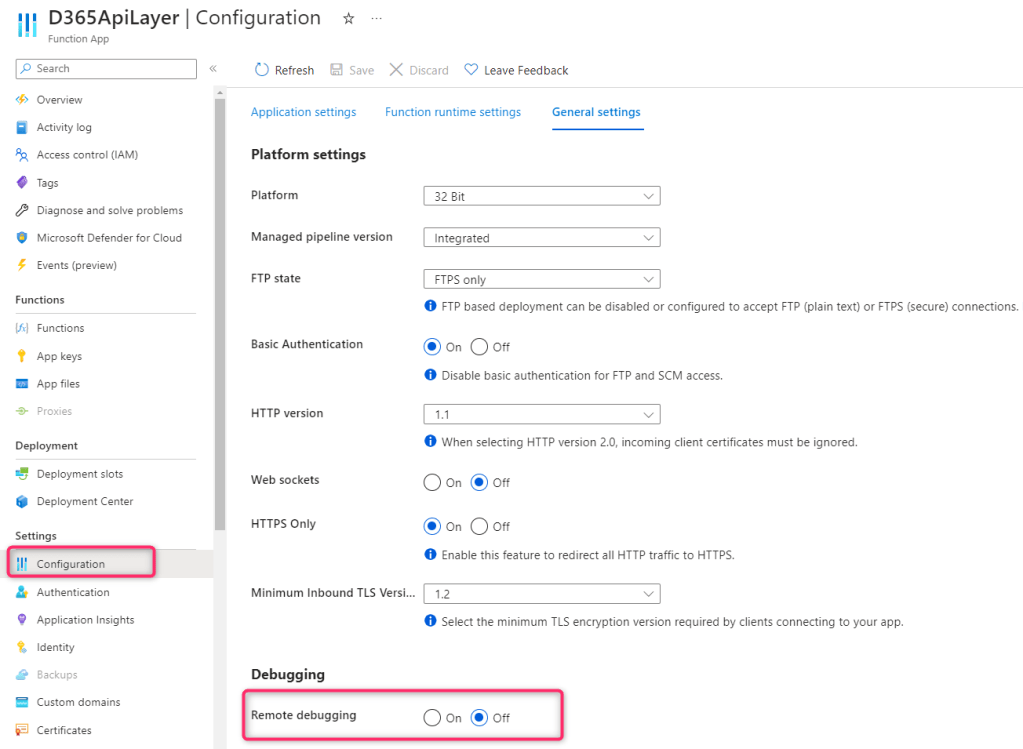
To debug an Azure Function app actually deployed on Azure, you need to first activate remote debugging. To do that, select your function app in the Azure Portal and on the Configuration menu select General settings. Here you have the Debugging section where you can see that remote debugging is turned off by default:
The first thing to do is turning on remote debugging and selecting the Visual Studio version you will use to debug:
Save the new settings and remore debugging is now enabled for the function app.
Then, to debug your function app you have two options:
- attaching to process
- using a publish profile
Debugging an Azure Function by attaching to process
Open Visual Studio and on the Debug menu you need to select Attach to Process:
In the Attach to process window, set Connection target with the url of your function app + the remote debugger port and press enter. Azure App Service uses port 4024 for the remote debugger.
Then, in the list of available processes select the process called w3wp.exe and click on Attach:
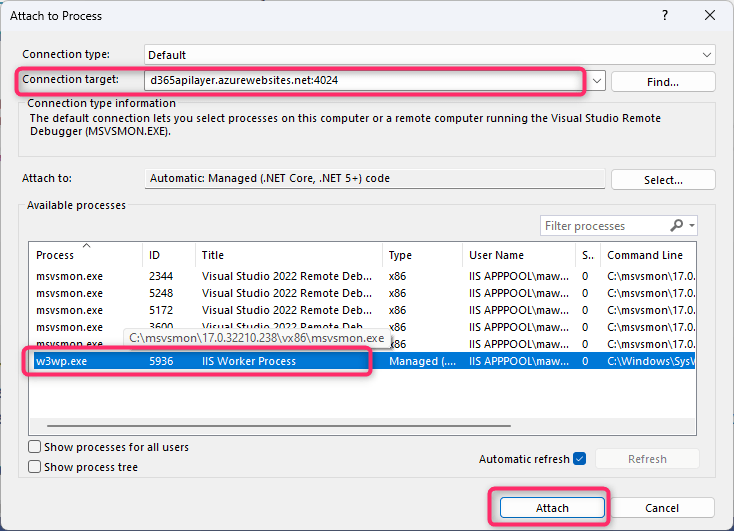
If you’re autenticated in Visual Studio with an account that have access to the Azure subscription, no authentication will be required. Otherwise an authentication prompt could be displayed.
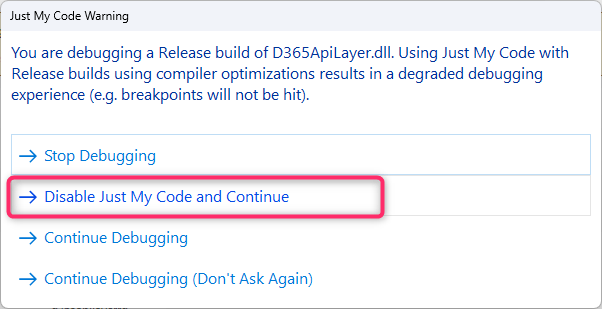
When attached, symbols of your function app will be downloaded. If the function code is deployed in a release mode, you should disable the Just My Code option in the Visual Studio debugger:
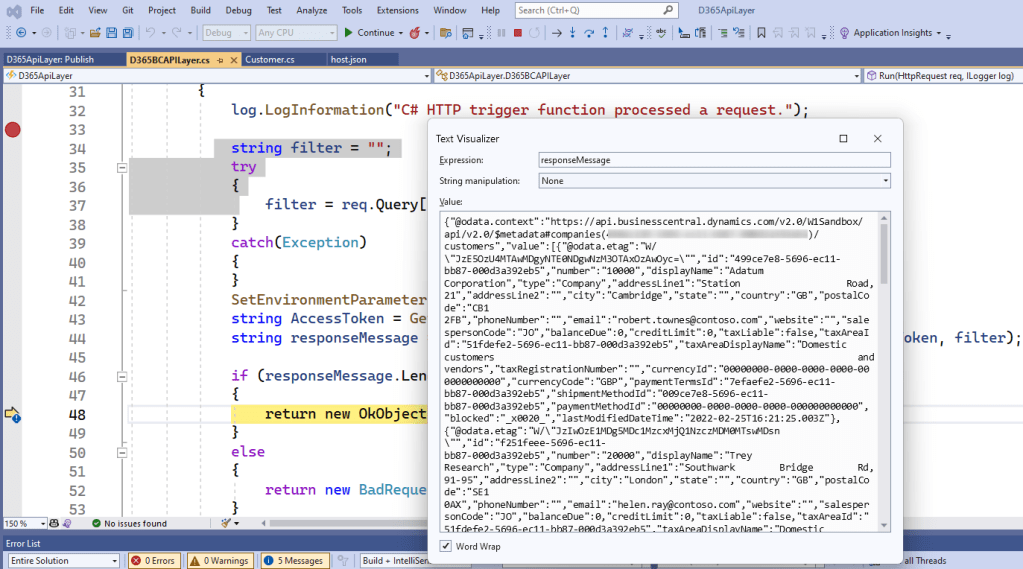
Now you can place your breakpoints in code:
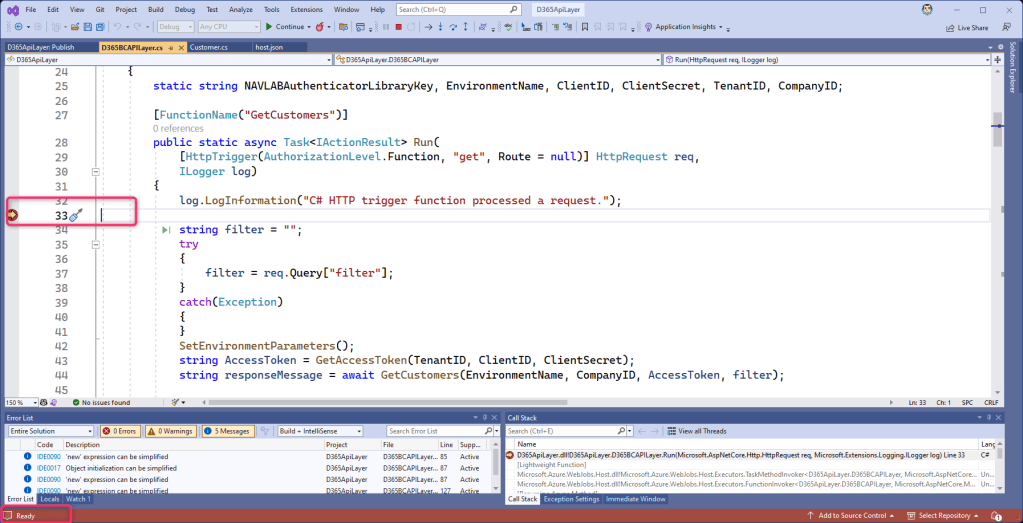
and start debugging:
Debugging an Azure Function via Publish Profile
You can also use the Azure Function app publish profile for debugging.
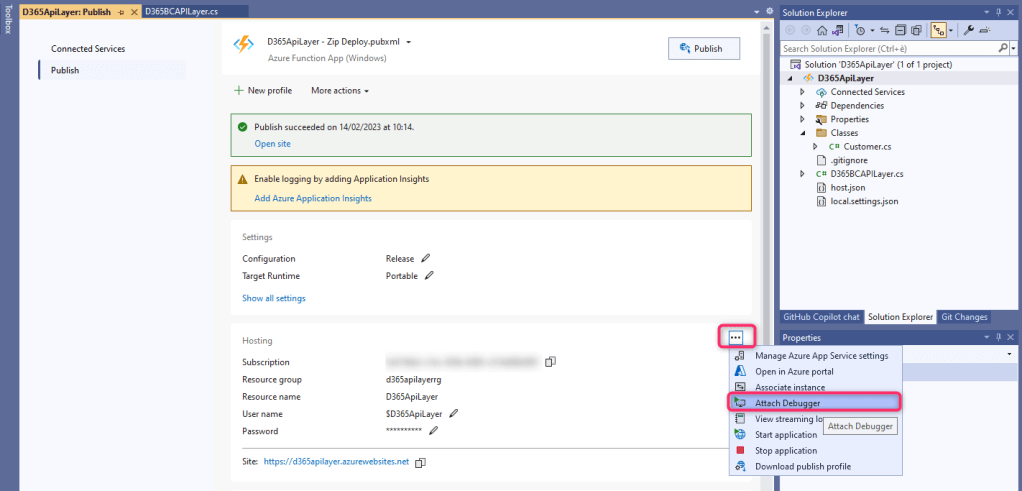
If you have deployed your Azure Function app from Visual Studio to an Azure Subscription, open your project, right-click on the function app and select Publish. The publish profile page will be opened and here you can click on the 3 dots in the hsoting details and select Attach Debugger:
Simbols will be downloaded and after that you can start debugging:
If you don’t have the publish profile (deployment not done from Visual Studio), you can go to the Azure Portal, open your Azure Function app and on the Overview pane select Get publish profile:
A file called <YOUR_FUNCTION_APP_NAME>.PublishSettings will be downloaded and this will be using to configure the publish profile inside Visual Studio.
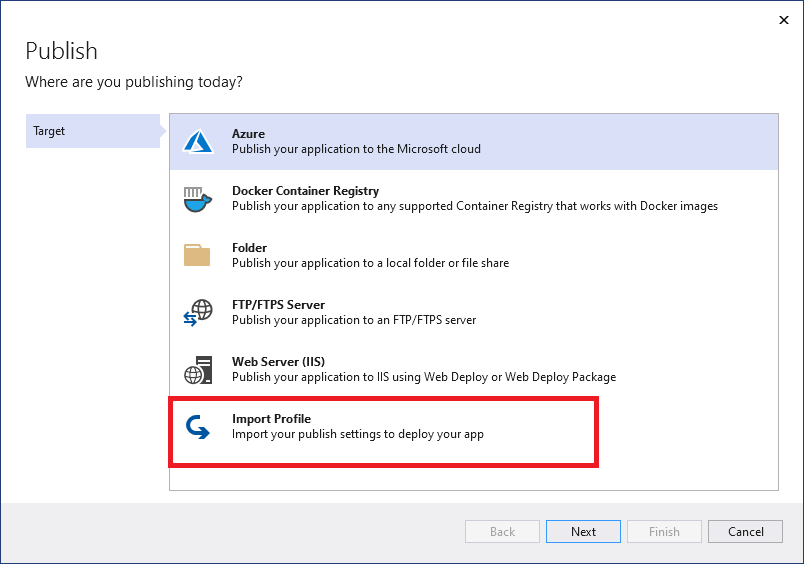
In Visual Studio, right-click on the function app and select Publish. This action opens the Publish window and from here you can import a publish profile if not yet existing:
On the Profile settings window, in the Configuration dropbox select the option Debug | Any CPU and click Save.
P.S. as explained during the session, I always suggest also to connect your Azure Function apps to Azure Application Insights and to add custom telemetry signals for better troubleshooting problems.
Hoping to have answered more clearly now… in any case, just ping me 🙂


