

Dynamics 365 Business Central 2023 Wave (v22) release introduces a new Analyze view mode in list pages directly on browser. End users and data analysts can analyze data from list pages directly in the client without the need to open the page in Excel or run a report.
Analysis mode is a new way of interacting with data on list pages. Instead of running reports using different options and filters, you can simply add multiple tabs that represent different tasks or views on the data. When you’re ready to analyze data on a list page (where you might have filtered data using a view or filter pane), simply switch to analysis mode:

How does it work?
Let’s imagine that we want to analyse your expected sales volume and so we want to see sales orders details with the sales amount for orders not yet shipped broken down to customer and year/month.
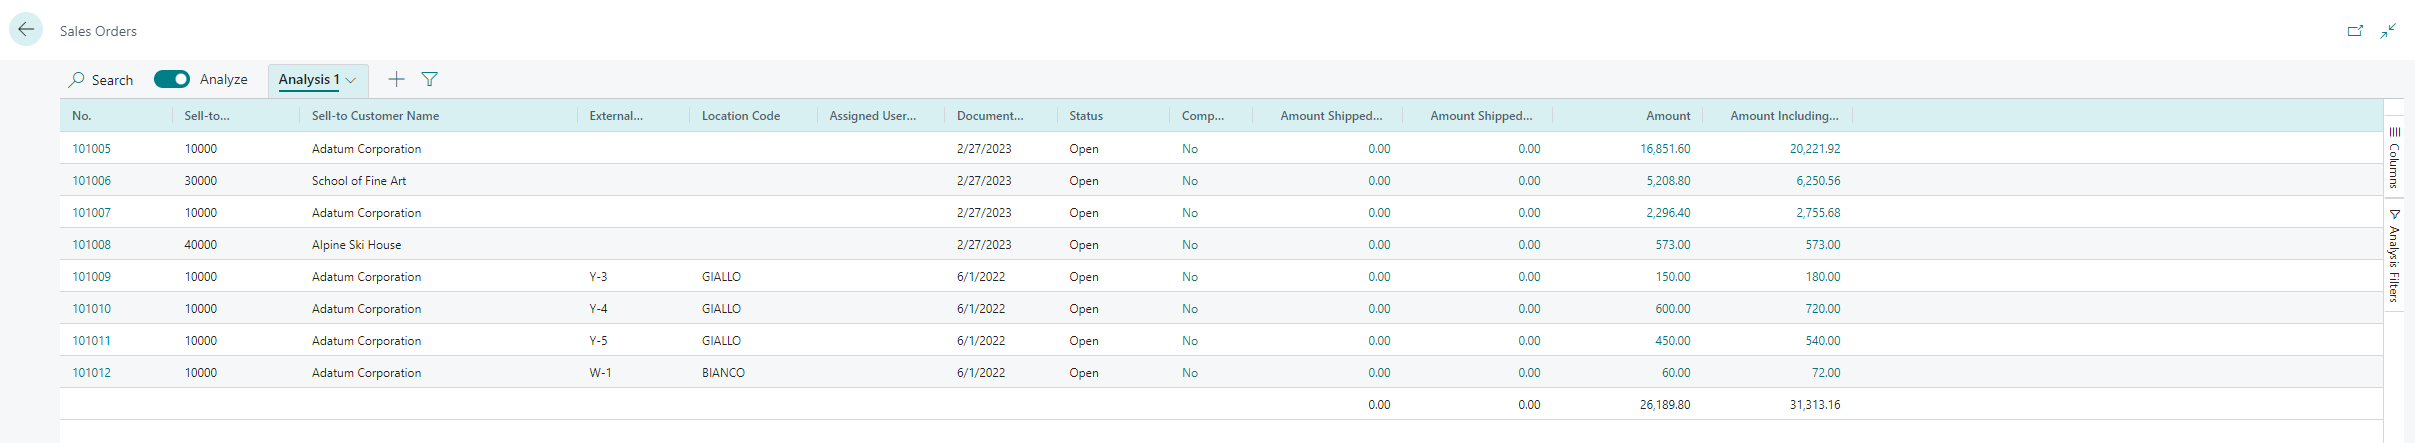
To do that, open the Sales Orders list page and switch on Analyze:

Analysis mode opens the data in a new experience that’s optimized for data analysis. When a page is in analysis mode, it’s split into two areas:
- The main data area (including a Tabs pane): use the data area to interact with the data. For columns that are summable, you can easily get descriptive statistics on a set of fields by marking them.
- The field modifier area: use the field modifier area to control the data to show and its format. On the menu, you choose the fields to show or hide.
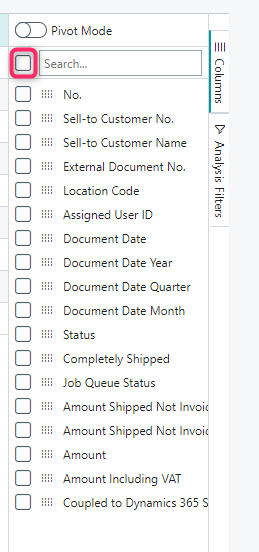
When the page is on Analysis View mode, go to the Columns menu and remove all columns (click the box next to the Search field):
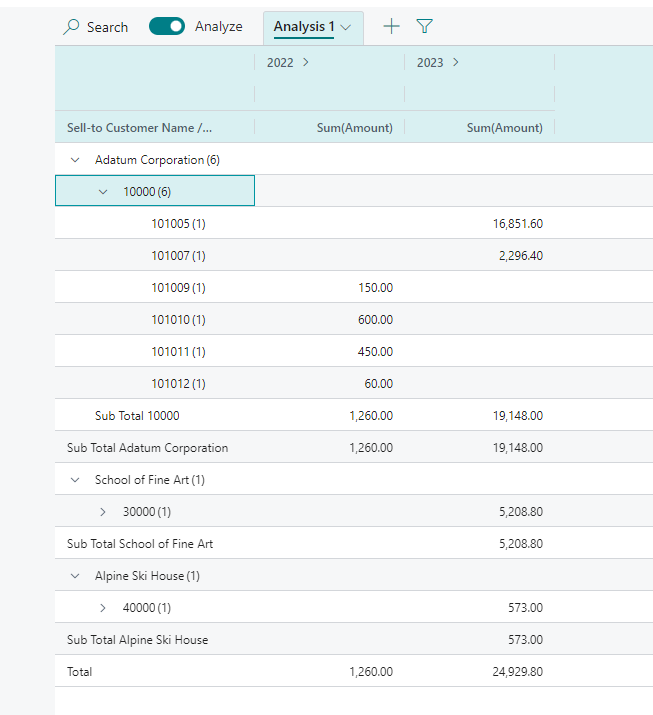
Turn on Pivot mode (located directly above the Search field). Now, drag the fields Sell-to Customer Name, Sell-to Customer No., and No. fields to the Row Groups area (in that order). Then drag the field Amount to the Values area. Finally, find the Document Date Year and Document Date Month fields and drag them to the Column Labels area (in that order).
You will have something like the following:

Now you can drill down on your data and do your analysis entirely in the browser:
You can also duplicate the analysis to do other analysis starting from the previously created one:

In this second analysis for example I’ve used the Amount Including VAT field:

By clicking on the Analysis Filters tab you can change and apply filters:

You can quickly do all the analysis you want without exporting data now. Just to give some other examples, here is an analysis showing how items move between locations:

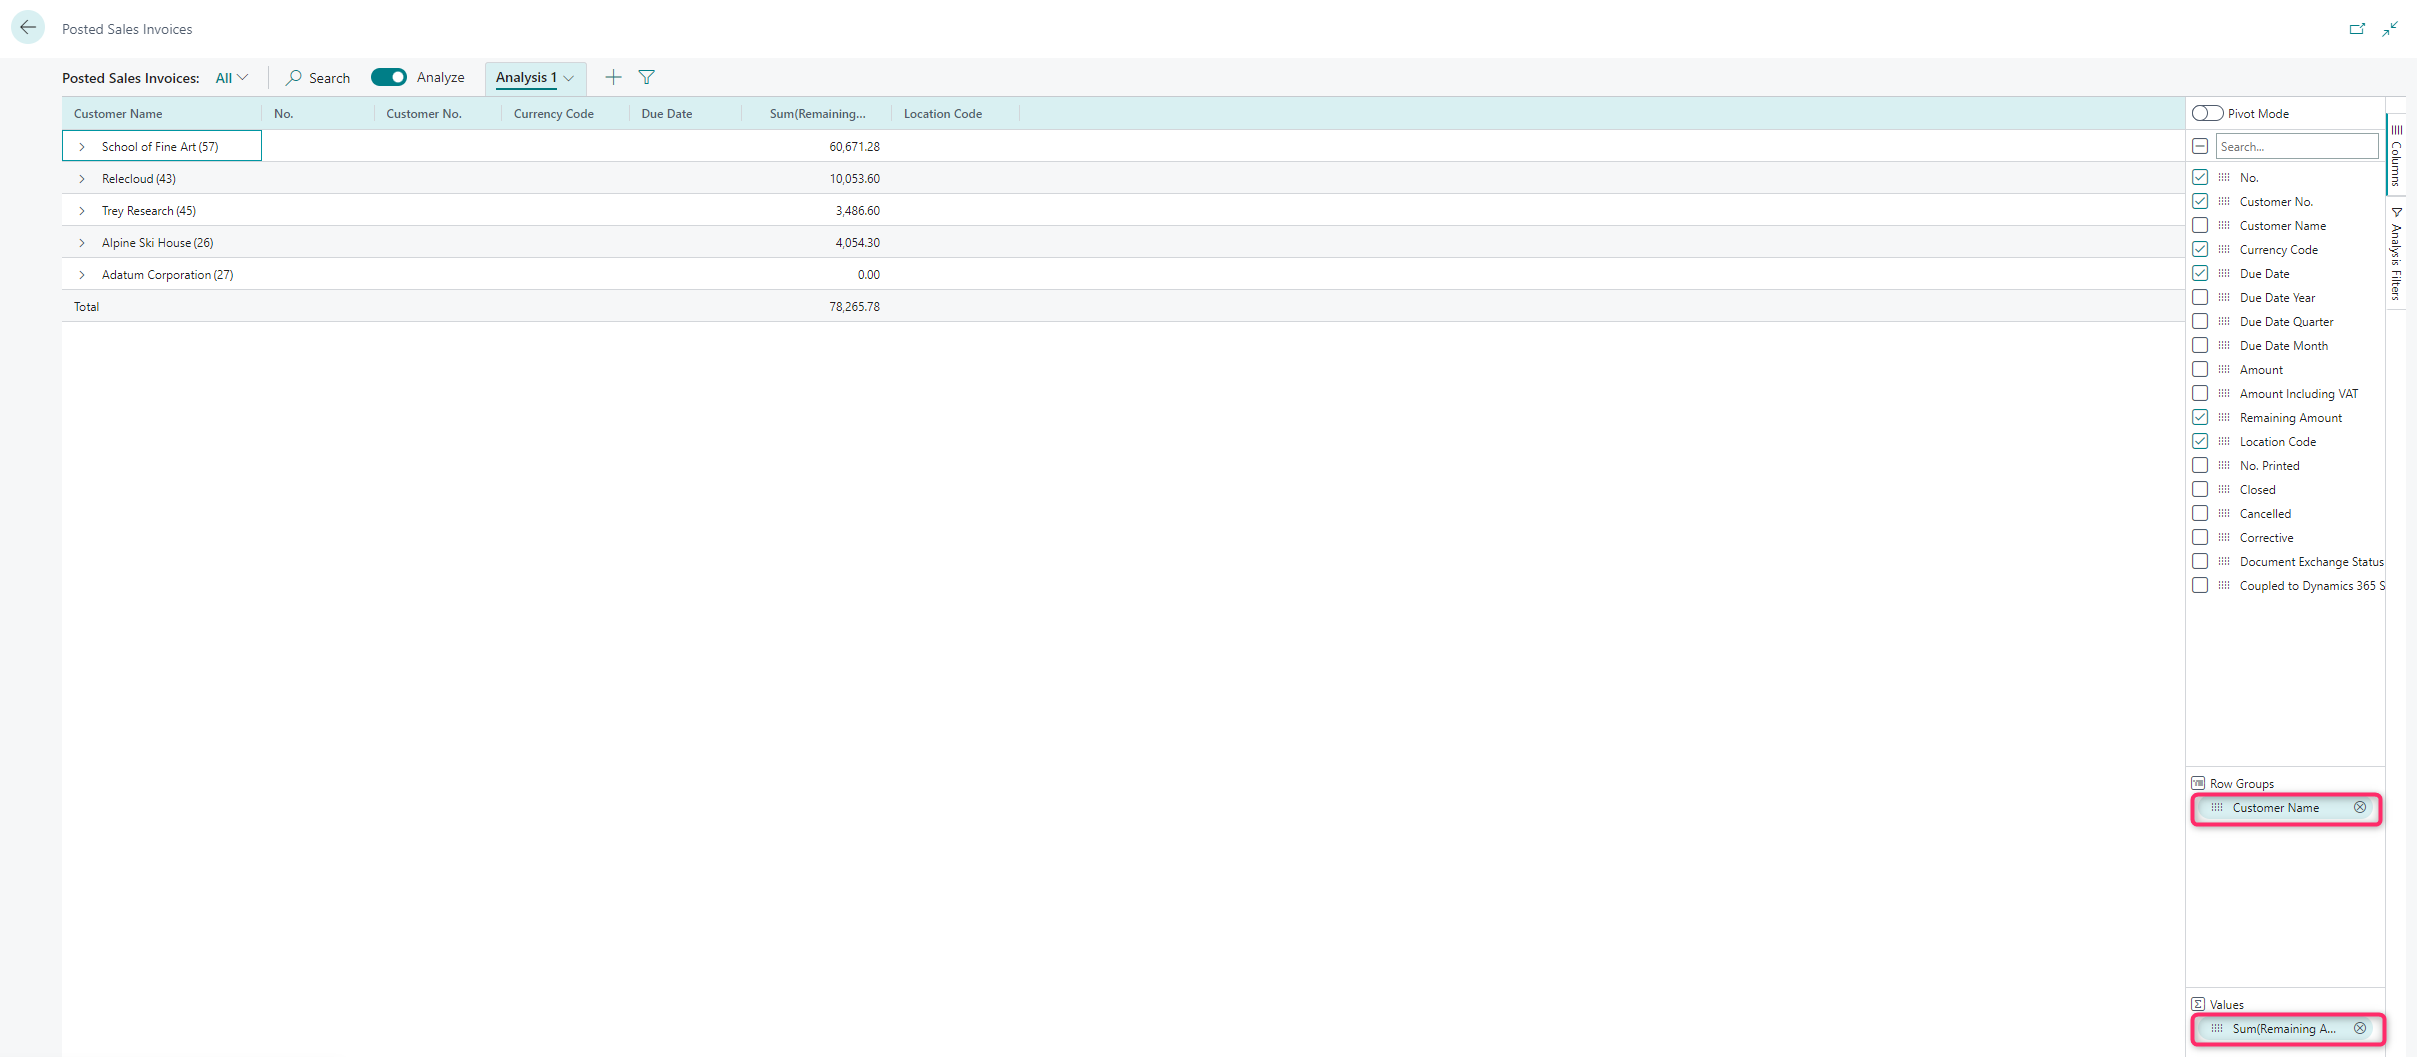
Here an analysis showing the remaining amount to invoice for customers:
I think it’s clear how this new feature works… analysis are just up to your fantasy now 🙂
Please remember that going to analysis mode will load all data into your browser and at the time of writing this post there’s a limit on the number of rows returned to the browser (currently above 100,000 rows). Applying the right filters is important here…
How to enable it?
The new Analysis View feature is in public preview, which means your administrator must turn it on before you can try it. To enable it, simply go to the Feature Management page and enable Analysis mode:

