

I talked here a lot on monitoring a Dynamics 365 Business Central tenant by using telemetry, but the telemetry practice should not be applied only on Dynamics 365 Business Central, but also on all the integrations you have and generally speaking on all your cloud services.
When thinking about integrations in a Dynamics 365 Business Central SaaS project, I think that cloud-based workflows are often the first response for handling integration’s tasks. In a well-architected Dynamics 365 Business Central SaaS project you should have cloud-based workflows in place and when talking about serverless workflows for integrations (that don’t run in the context of a user session), the response is: Azure Logic Apps (please stay away from people that suggest you to solve all workflows-related tasks with Power Automate!).
When you have different Azure Logic Apps workflows running in your cloud-based solution, monitoring them is essential and crucial.
I think that you know that you can monitor an Azure Logic App instance by going to the instance itself and from the Overview tab you can immediately check the failures and the successfully executed instances:

You can also select the Metrics tab and then select a metric to inspect. For example, here is the Runs completed metric in the last hour of my workflow execution, where you can see that I had 8 instances running and the chart shows how they was distributed on time:
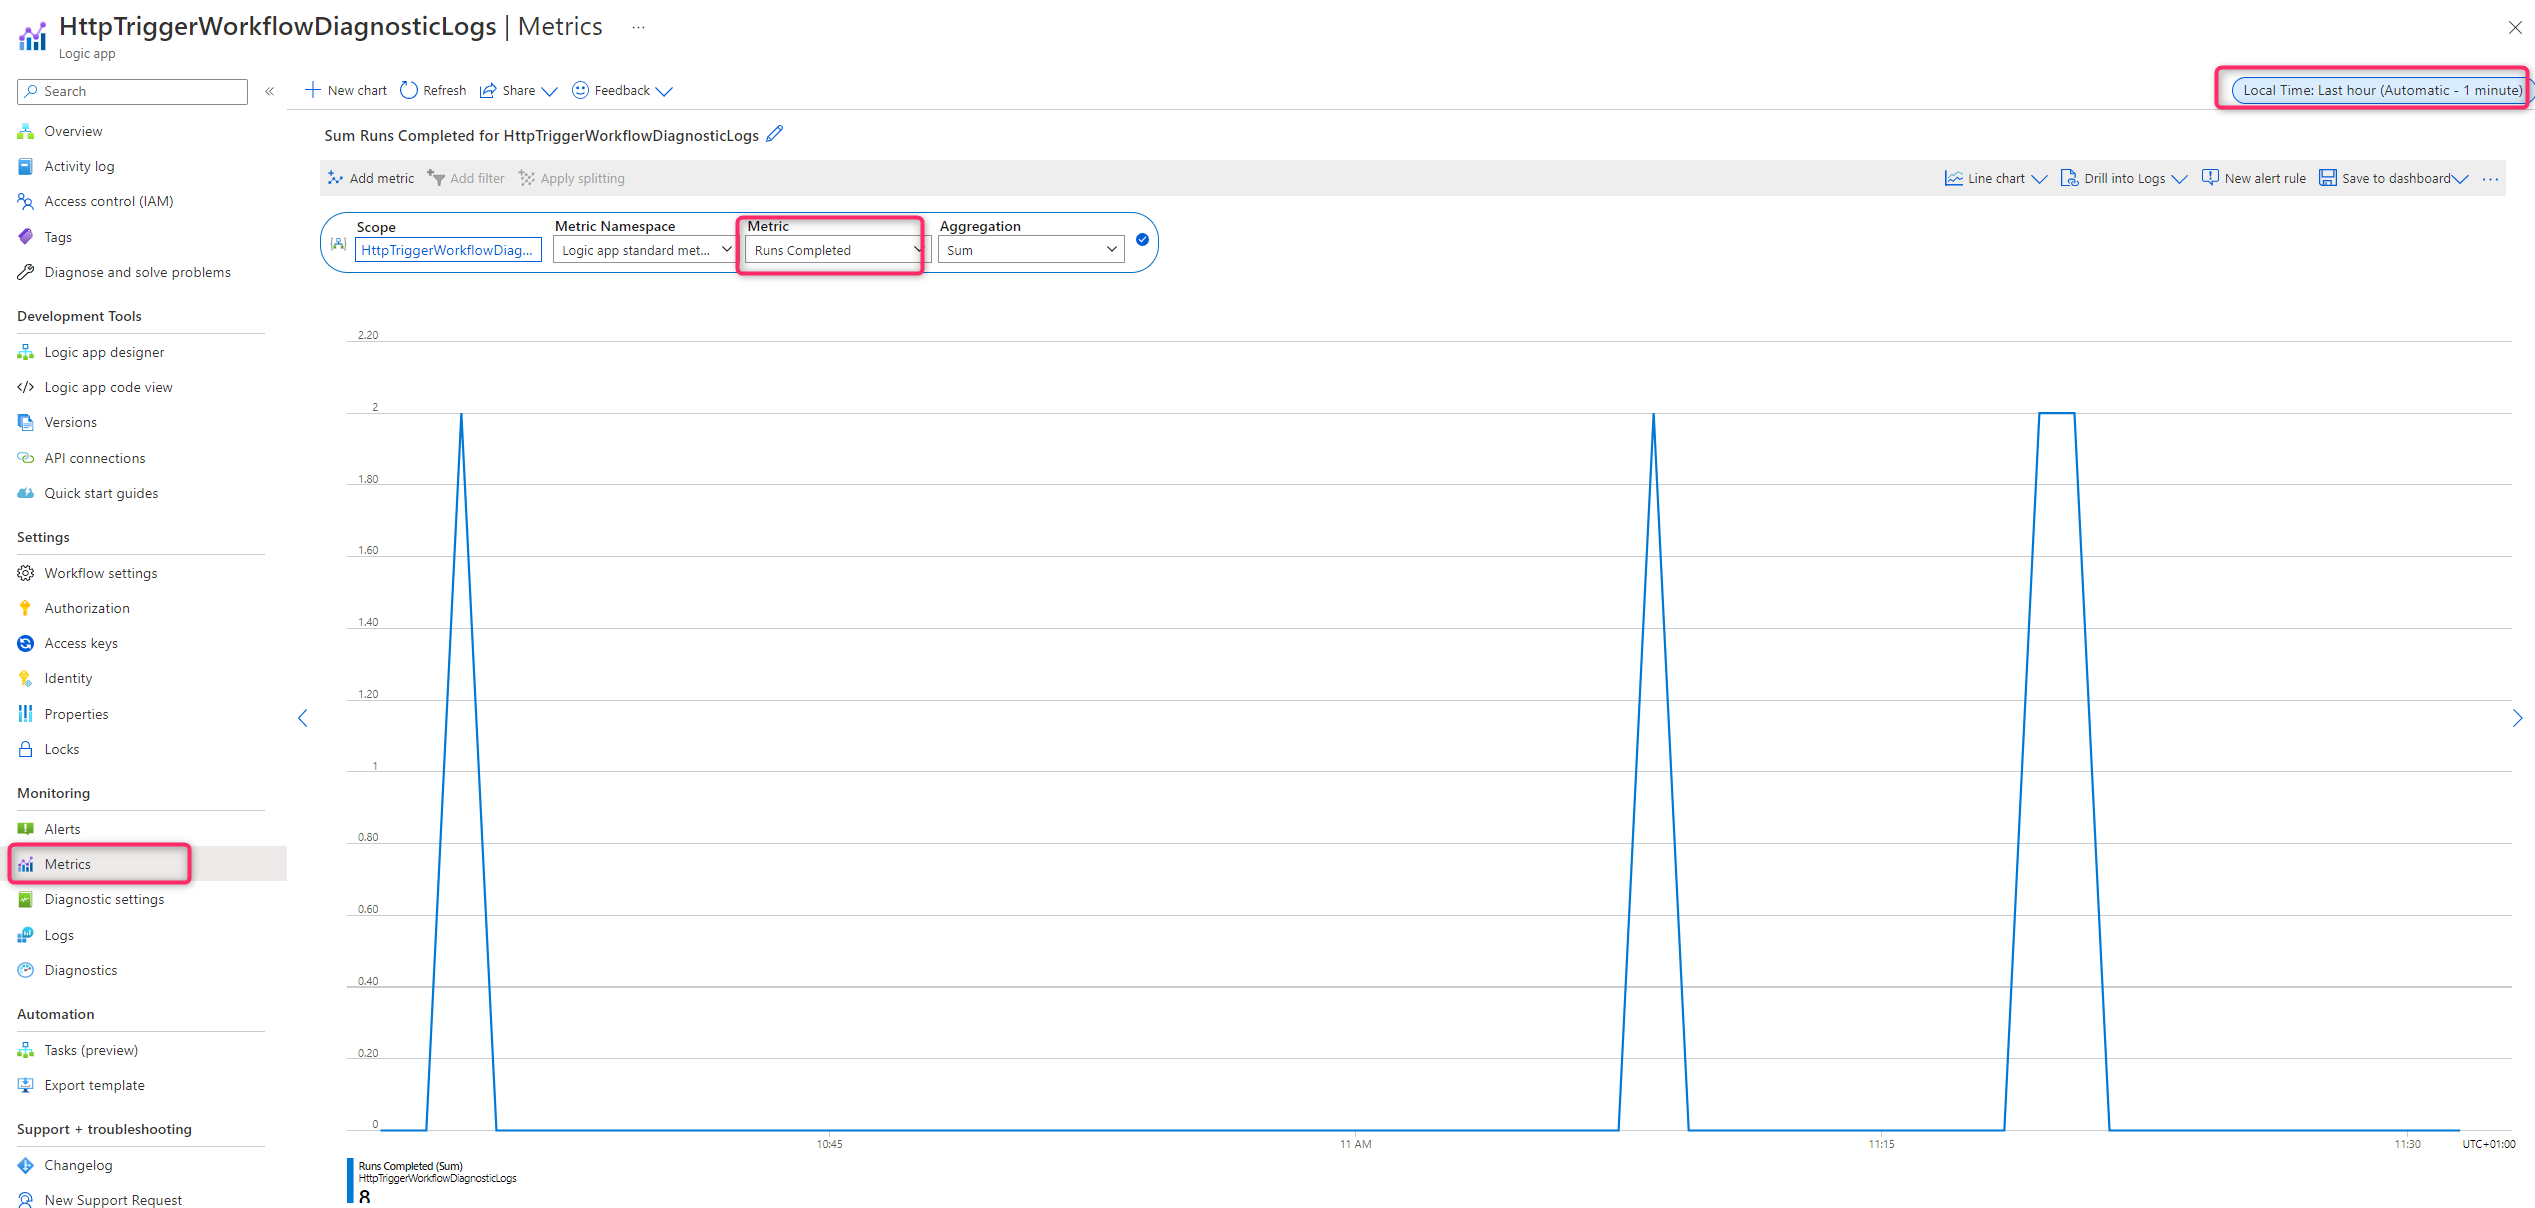
But if you want more?
The suggested way to perform an advanced monitoring practice of your cloud-based workflows (Logic Apps workflows) is to use a Log Analytics Workspace and collect all the Logic Apps workflows diagnostics on this workspace. From here you can analyze all your workflows in a centralized and advanced way.
How can I use Log Analytics with Azure Logic Apps?
To start using advanced telemetries for your Azure Logic Apps workflows, the first step is to create a Log Analytics Workspace instance that will be used to collect telemetries for your workflows:

When you create a new Azure Logic Apps workflow, connect it to the Log Analytics workspace instance by enabling log analytics and by selecting your Log Analytics workspace:

Now you’re ready to go!
For this blog post, I’ve created a simple Logic Apps workflows that starts from a “When an HTTP request is received” trigger and then performs some actions (integrate with Dynamics 365 Business Central and more).
The workflow receives a Sales Order object from external applications in the following JSON format (via the request body):
{
	"No": "SO23-0001",
	"CustomerNo": "C0001",
	"OrderDate": "2023-02-10",
	"Lines": [{
			"LineNo": 10000,
			"ItemNo": "ITEM001",
			"Quantity": "1",
			"Price": "148.95"
		},
		{
			"LineNo": 20000,
			"ItemNo": "ITEM001",
			"Quantity": "10",
			"Price": "1250"
		}
	]
}
The workflow is defined as follows (the Scope-contained part here is not shown because it’s not relevant for this post):

From the Log Analytics workspace we can perform KQL queries by using the AzureDiagnostics object and retrieve informations about the telemetries of our flows.
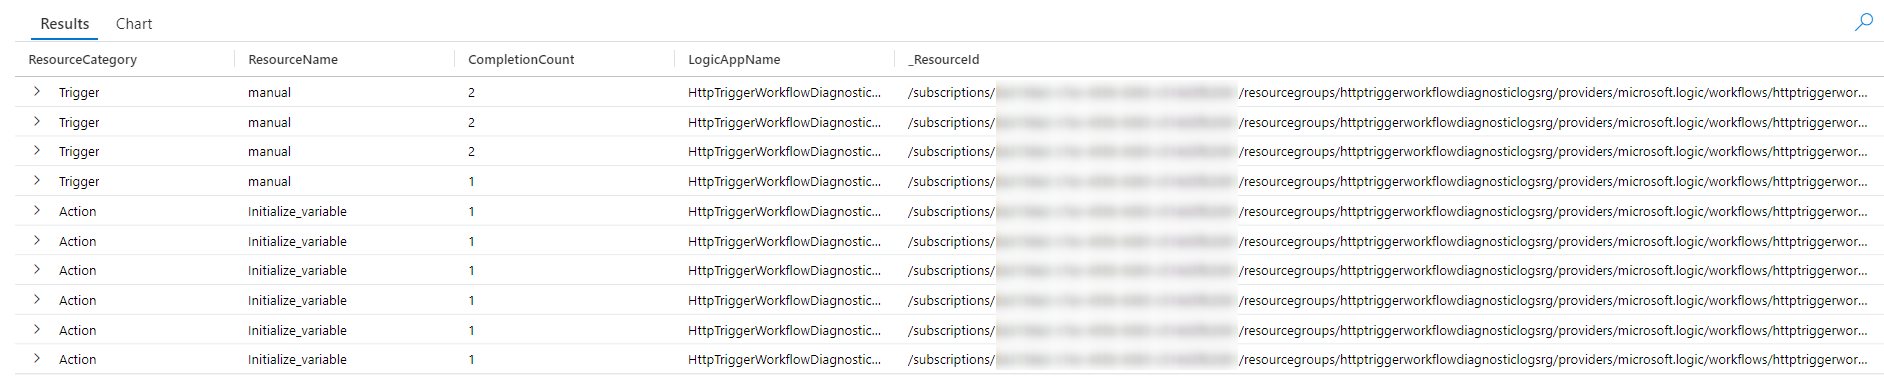
For example, this is a KQL query that shows details about my successfully executed flows:
AzureDiagnostics
| where ResourceProvider  == "MICROSOFT.LOGIC"
| where Category == "WorkflowRuntime"
| where status_s == "Succeeded"
| where OperationName has "workflowActionCompleted" or OperationName has "workflowTriggerCompleted"
| extend ResourceName = coalesce(resource_actionName_s, resource_triggerName_s)
| extend ResourceCategory = substring(OperationName, 34, strlen(OperationName) - 43) | summarize dcount(resource_runId_s) by code_s, ResourceName, resource_workflowName_s, ResourceCategory, _ResourceId
| project ResourceCategory, ResourceName , CompletionCount = dcount_resource_runId_s , ErrorCode = code_s, LogicAppName = resource_workflowName_s, _ResourceId
| order by CompletionCount desc
The following KQL query shows the workflow failures details:
AzureDiagnostics
| where ResourceProvider  == "MICROSOFT.LOGIC"
| where Category == "WorkflowRuntime"
| where status_s == "Failed"
| where OperationName has "workflowActionCompleted" or OperationName has "workflowTriggerCompleted"
| extend ResourceName = coalesce(resource_actionName_s, resource_triggerName_s)
| extend ResourceCategory = substring(OperationName, 34, strlen(OperationName) - 43) | summarize dcount(resource_runId_s) by code_s, ResourceName, resource_workflowName_s, ResourceCategory, _ResourceId
| project ResourceCategory, ResourceName , FailureCount = dcount_resource_runId_s , ErrorCode = code_s, LogicAppName = resource_workflowName_s, _ResourceId
| order by FailureCount desc
The following KQL query shows you the execution distribution by workflows (hourly) and it’s useful to check the usage of your flows during the day:
AzureDiagnostics
| where ResourceProvider == "MICROSOFT.LOGIC"
| where Category == "WorkflowRuntime"
| where OperationName has "workflowRunStarted"
| summarize dcount(resource_runId_s) by bin(TimeGenerated, 1h), resource_workflowName_s
| render timechart
The following KQL query shows you the billable execution for your flows. Remember that in Azure Logic Apps you pay for action executions (0.00XX per action):
AzureDiagnostics
| where ResourceProvider == "MICROSOFT.LOGIC"
| where Category == "WorkflowRuntime"
| where OperationName has "workflowTriggerStarted" or OperationName has "workflowActionStarted"
| summarize TotalRuns = dcount(resource_runId_s) by OperationName, WorkflowName = resource_workflowName_s

But what about if I would like to monitor executions or failures of my flows by searching the telemetries using business data?
For example, here I would like to retrieve data about flows by searching the telemetry data for a sales order number. Is this possible? The answer is YES: you can use Tracked Properties. Tracked properties are workflows properties that are tracked when the appropriate action is executed. Who was with me last week in the training I’ve done in Microsoft Italy about Dynamics 365 Business Central and Azure Services now knows that, but for others I will share here how to do that.
To use Tracked Properties in an Azure Logic App action, select that action and then click on Settings:

The action settings panel opens. As said before, I want to track the sales order number for every workflow execution. To do that, I select Tracked Properties and here fill the property as follows:

Here I’m creating a property called OrderNo that takes the values of the No field of my JSON request body. You can create as many tracked properties as you want.
What happens now on my workflow telemetry?
The tracked properties are now logged in the AzureDiagnostics object as a new colun called trackedProperties_Propertyname_s and you can retrieve them from telemetry. For example, if I want to retrieve the workflow iunstance details that processes the sales order SO23.0002 I can do the follwoing:
AzureDiagnostics
| where trackedProperties_OrderNo_s contains "SO23-0002"

I can see that the order was processed in that date and the processing was succeeded.
If you select the Log Analytics workspace and you click on Configure monitoring solutions (View solutions):

you can see also a nice ovierview of all your workflows status, with the possibility to drill into details:
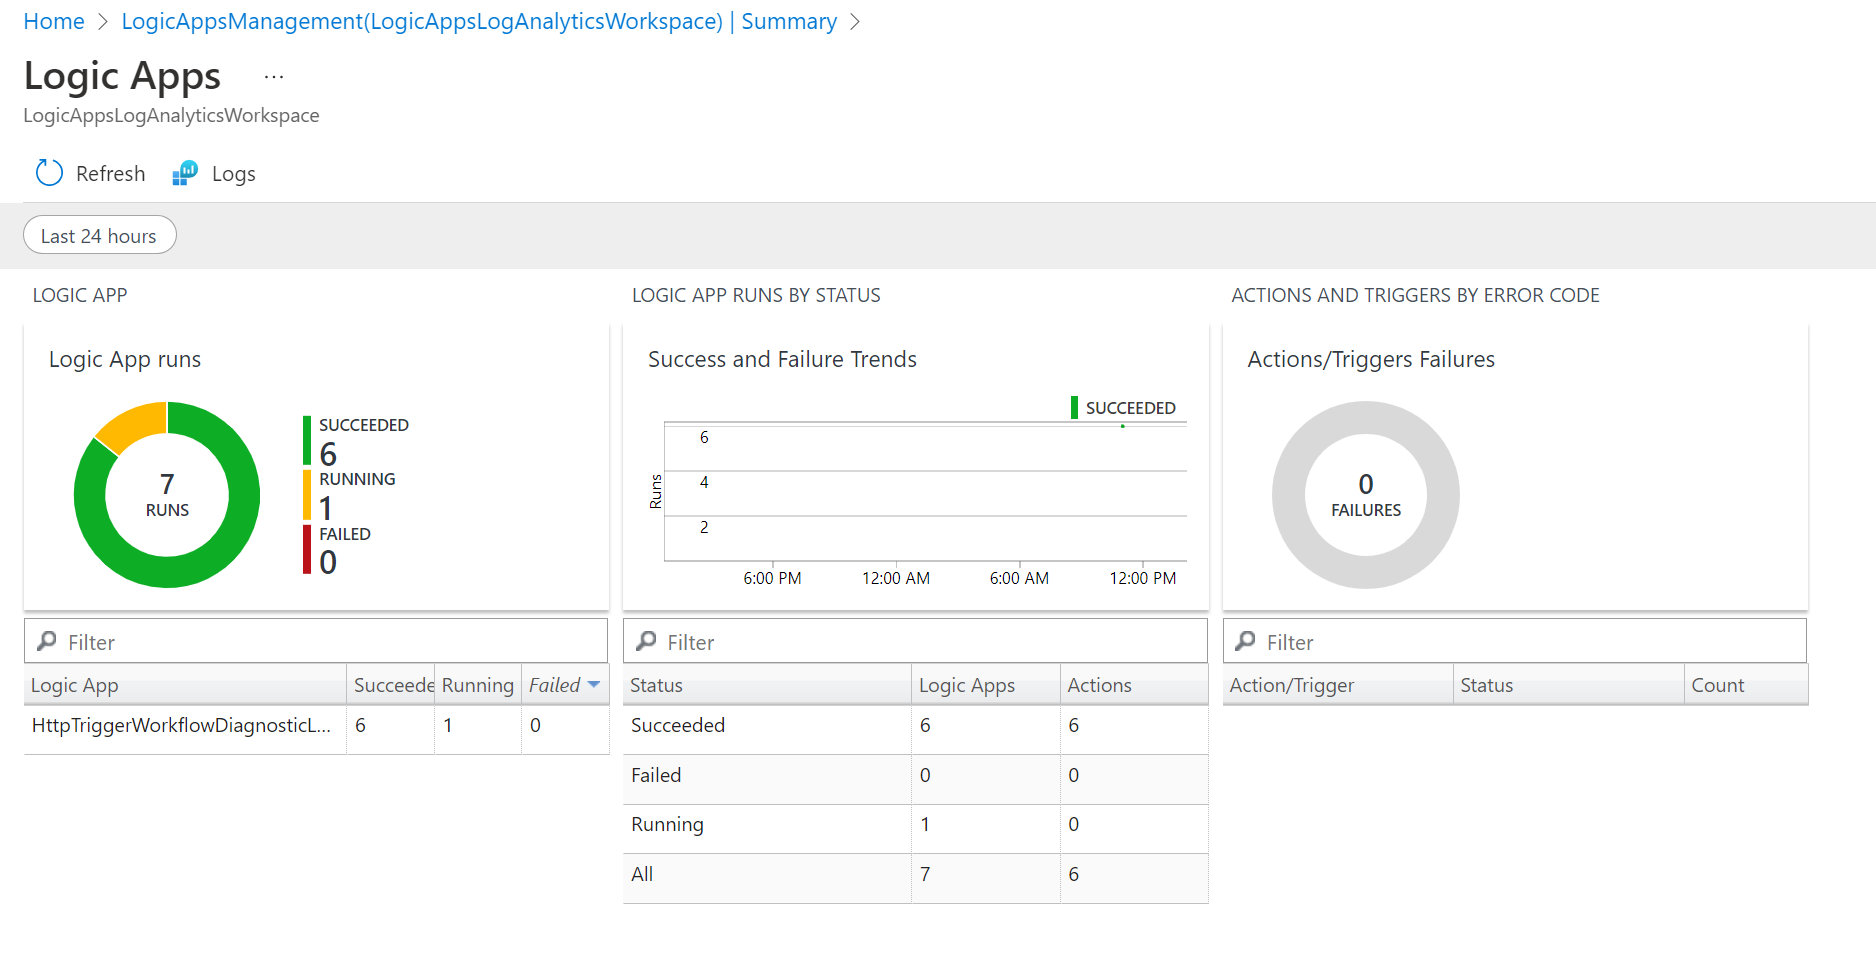
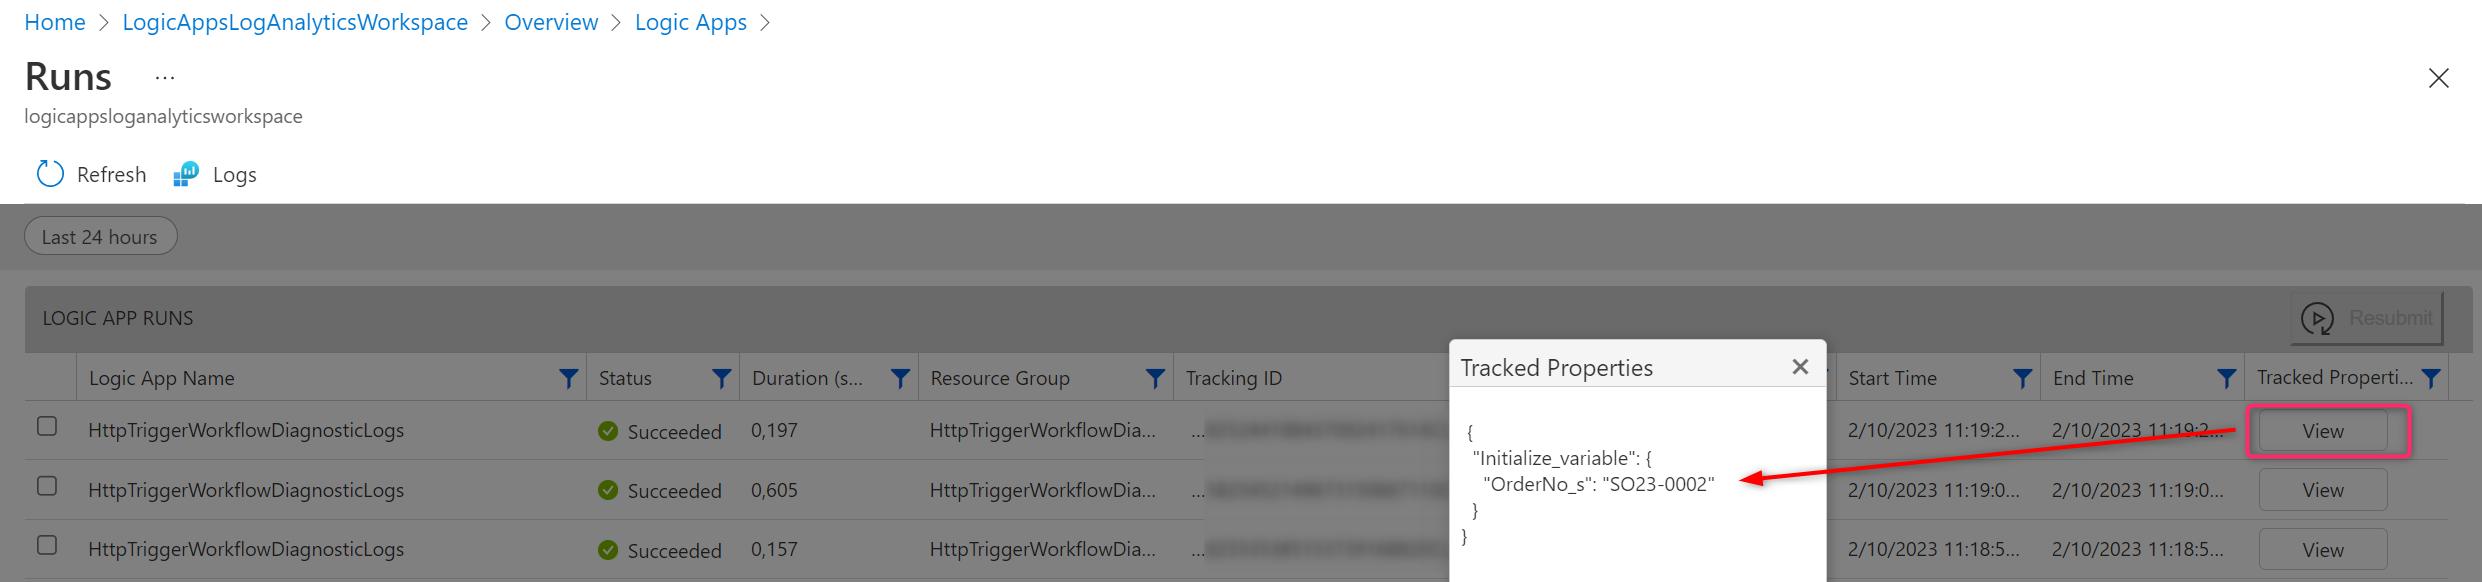
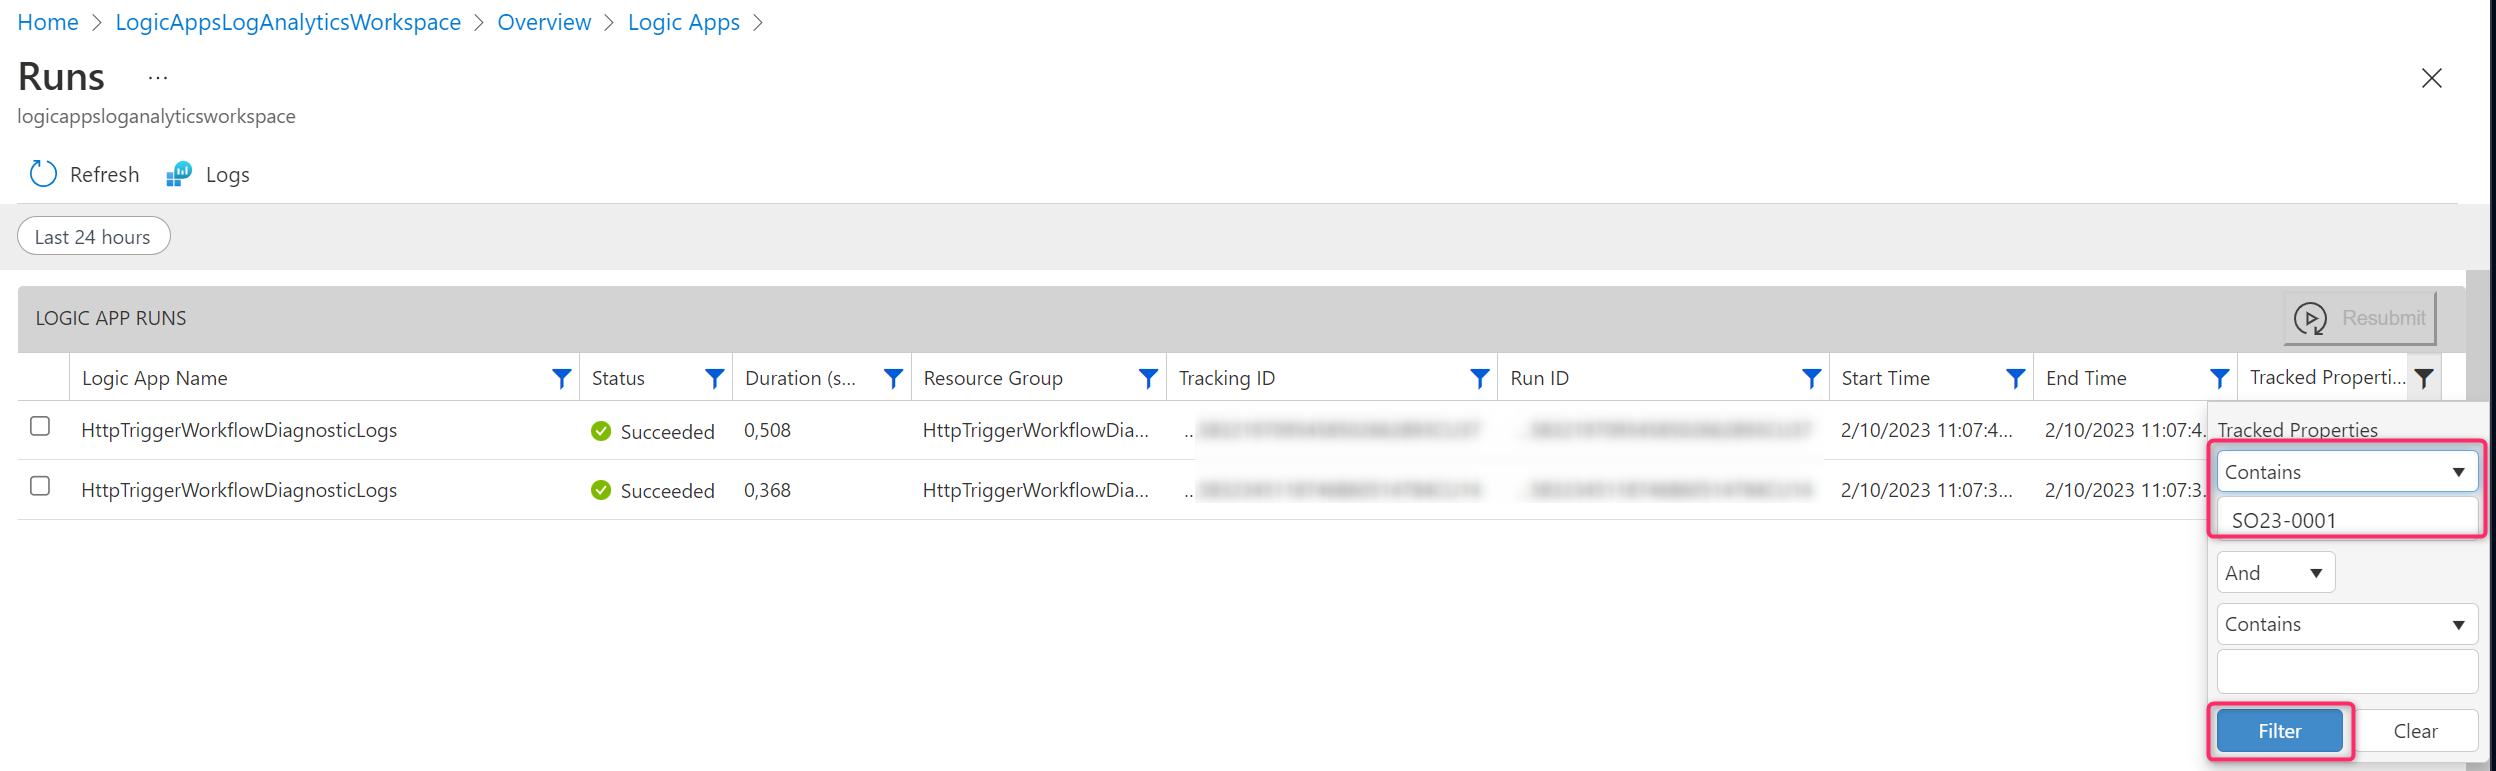
From here. if you click on the Logic App runs chart, you can see the details of each workflow execution. The nice thing is that the detailed view shows also if the telemetry entriy has Tracked Properties:

and you can esily inspect the values (here is for example my sales order number for this workflow run):
You can also directly filter the view by the Tracking Property value:
I think that byapplying these tips you can have a great monitoring experience for your workflows and by using Log Analytics workspaces you can have a centralized place for your workflow telemetries.
But if I have already existing workflows that are not connected to a Log Analytics workspace?
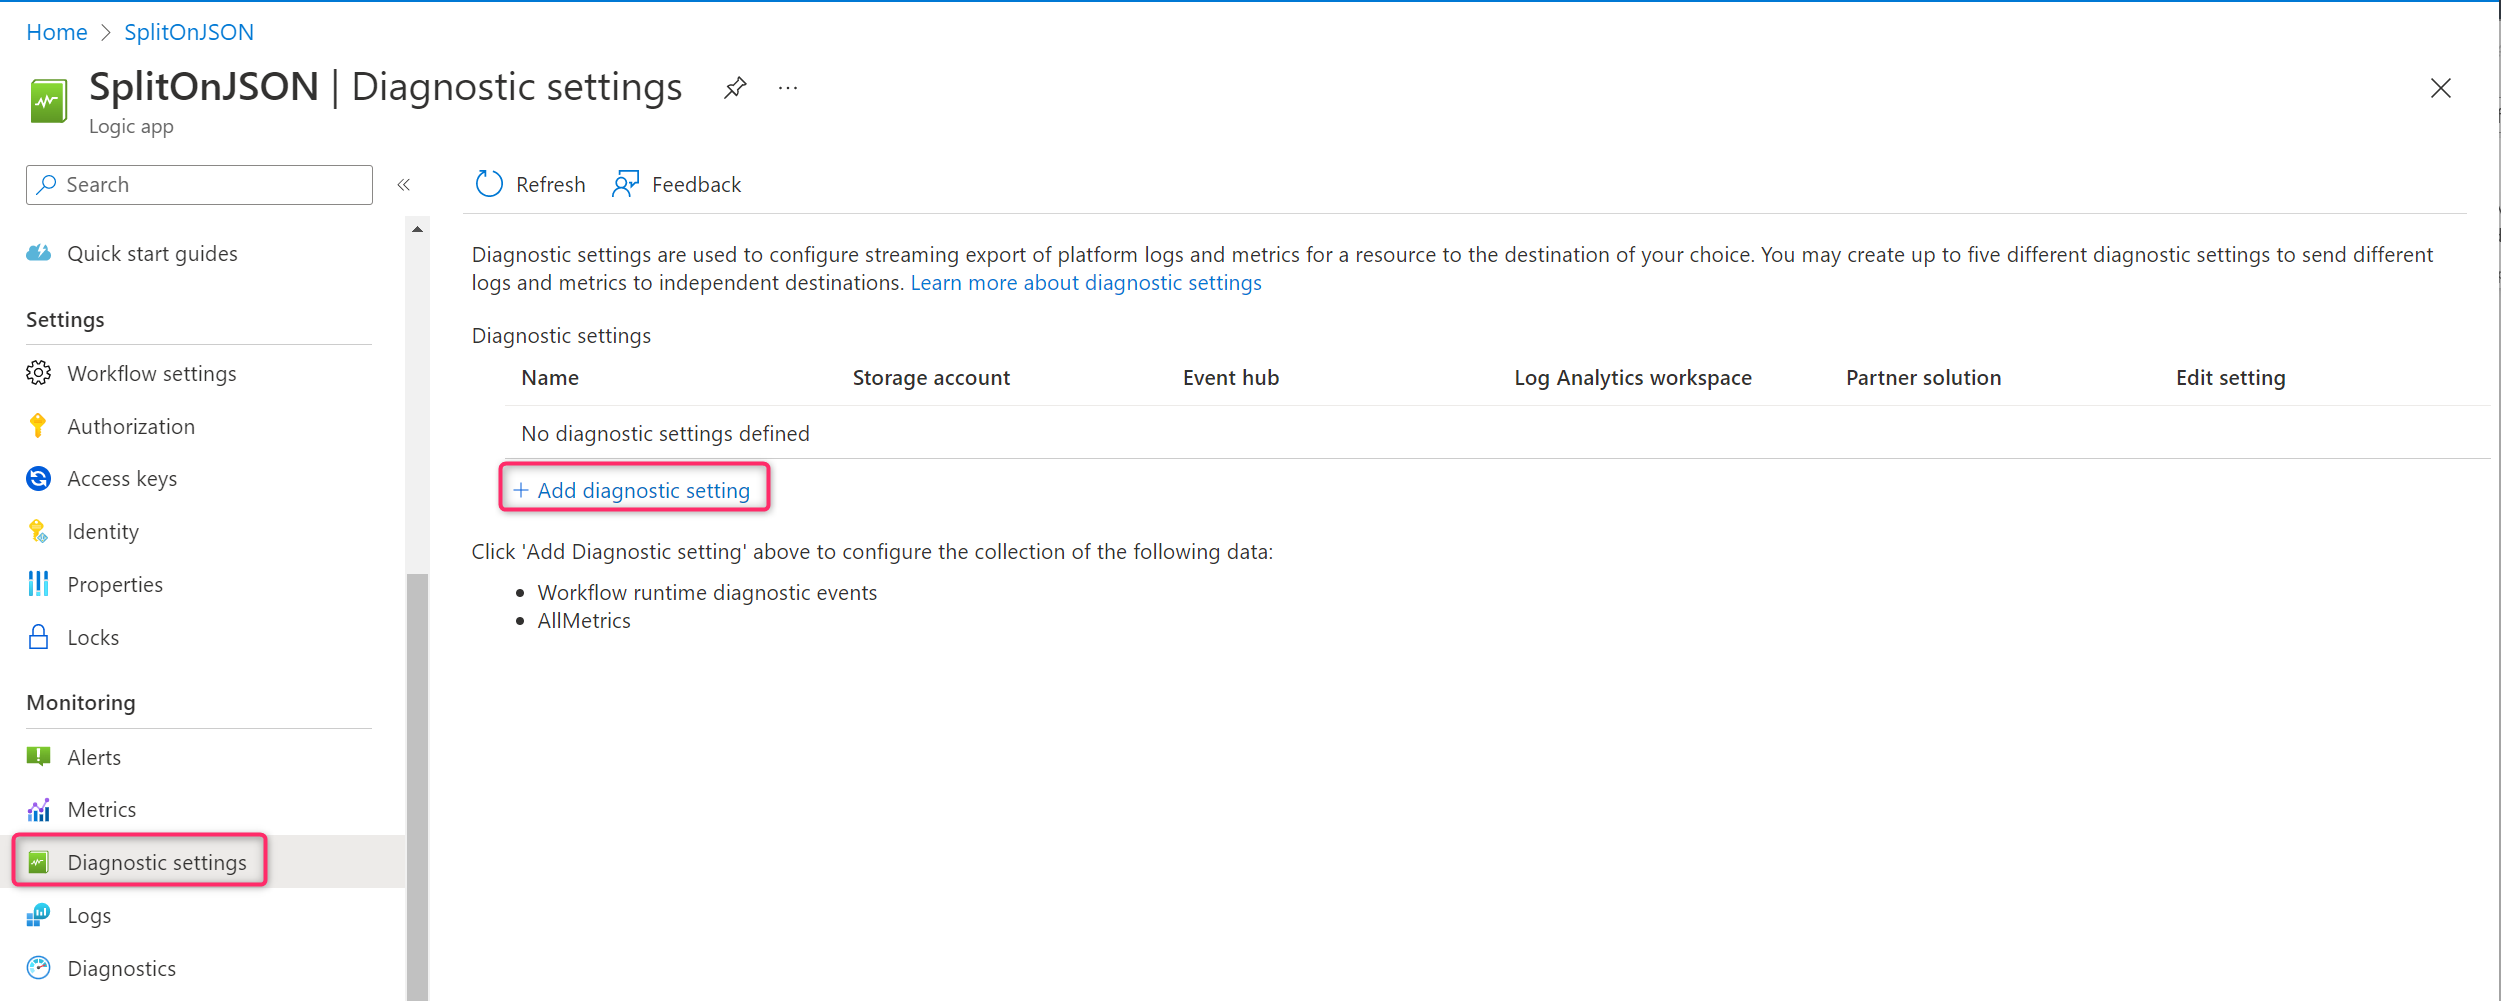
This is a common question I receive when I talked about these things. We have previously created a new Azure Logic App workflow and during creation we connect the new instance to our Log Analytics workspace. But if I have existing Azure Logic Apps not connected to an Azure Log Anaslyticd workspace, how can I start collecting their telemetries in a consolidated way? How can I redirect their telemetries to the Log Analytics workspace?
To do that, select your Azure Logic App resource and then click on Diagnostic settings|Add diagnostic setting:
You can now create a new Diagnostic setting for your workflow by selecting your Log Analytics workspace and the type of telemetries that you want to send (metrics and logs):

As I said always, monitoring your resources in a cloud environment is a best practice to follow. Start doing that…
