

Some days ago I was helping a partner on setting up the telemetries for one of their customer’s Dynamics 365 Business Central on-premise installations and they asked me an interesting question: is it possible to detect anomalies on telemetry ingestion, like for example if too much telemetry is ingested in a day or if no telemetry is sent to Azure Application Insights (for example, due to internet connection blocked, problem experienced by this customer some weeks ago)?
This makes me thinking…
My idea to detect these “anomalies” and react immediately is to set up an alert based on the Application Insights’s Usage data type. In this way you can monitor if you have spikes in your data ingestion during the day or if you have no data ingested in Application Insights for a particular time slot.
To use the Usage data type, you need to access the workspace lined to your Azure Application Insights instance (in the Overview panel you have the indication of the workspace) and from here you can perform KQL queries on logs and create alerts on the workspace activities.
For example, if you want to monitor if some telemetry signals are injected in the last hour, you can use the following KQL query:
Usage
| where TimeGenerated > now(-60min)
| count
You can execute this query periodically and if the result is 0, there’s something strange (and you can prevent networking errors like in the previously mentioned customer’s case).
The other question was: can I compare the medium of the ingested telemetry signals of last week to the medium of the ingested telemetry signals in the last N hours (for example 3), in order to discover anomaly spikes?
To do that, I think that you can execute two KQL queries and compare their returned values. The first KQL query shows the average volume (Mb) of the ingested telemetry in the last 7 days (excluded last 3 hours):
Usage
| where TimeGenerated > startofday(ago(7d)) and TimeGenerated < now(-3hour)
| summarize AverageQuantity = avg(Quantity)

The second query shows the average volume of the ingested telemetry in the last 2 hours:
Usage
| where TimeGenerated > now(-3hour)
| summarize AverageQuantityLastPeriod = avg(Quantity)

And you can compare these values. If the delta is too much (where you need to define what is too much for you), send an alert.
You can obviously aso inspect the data. For example, in my case (when taking these screenshots) I observed that I have a lot of AppTraces injected into the last hour compared to the medium of the other hours:

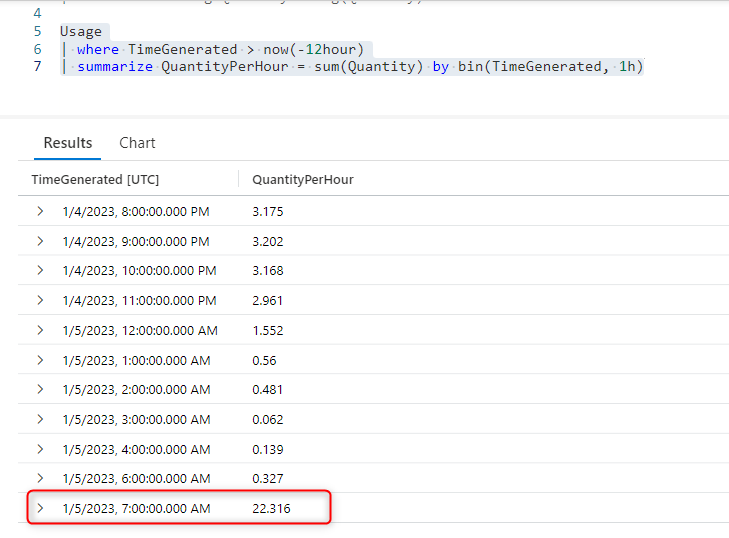
You can also immediately see this spike in AppTraces injection if you compare the sum of the injected telemetry quantity (Mb) in the last 12 hours for example:
Usage
| where TimeGenerated > now(-12hour)
| summarize QuantityPerHour = sum(Quantity) by bin(TimeGenerated, 1h)
or if you prefer a timechart, here is the spike:

Another interesting analysis is the billable data volume by type over the previous month rendered in a barchart:
Usage
| where TimeGenerated > ago(32d)
| where StartTime >= startofday(ago(31d)) and EndTime < startofday(now())
| where IsBillable == true
| summarize BillableDataGB = sum(Quantity) / 1000. by bin(StartTime, 1d), DataType
| render columnchart

The barchart is nice in order to see the composition of the billable price per day (here AppTraces win).
With these analysis you can check your telemetry data, you can control costs and anomalies and you can also use these queries to set up alerts to react proactively.
NOTE: I’ve added the above queries also in the Microsoft’s BCTech repo on Github.
