

I think that you already know that the area of telemetries is a fast moving area in the Dynamics 365 Business Central field. The new year has started, some improvements on this area are cooking and our “King of the Heroes” Kennie has just shared the monthly report about the Power BI Telemetry Apps news.
Just for reference, you can download the Power BI apps from here (Power BI Pro license is required):
- Environment telemetry app: https://aka.ms/bctelemetryreport
- ISV telemetry app: https://aka.ms/bctelemetry-isv-app
The first thing that worth mentioning is that the last versions of official Microsoft’s Power BI Apps for Business Central telemetry (environment telemetries and app telemetries) introduce a faster data refresh and the ability to load larger datasets. For telemetry databases with a lot of data, sometimes refreshing the app can take a long time (and sometimes you can experience a time out error that requires you to lower the lookback period). The great Kennie tuned the datasets to make them load data faster and also increased the timeout values for the queries. The experience should be better now.
Other nice additions to these apps in the latest version:
- The long running SQL queries page now has a new “Explanation” column that explains what the SQL does and provides suggestions for tuning.
- The page for Report data now shows better descriptive statistics to help you find troublesome reports.
- Added a new page that shows data from performance toolkit runs. This can be useful to track performance regressions over time.

Two new interesting additions to the RAW Business Central telemetry signals are available now. The first feature that I personally love and use a lot is related to the telemetry event RT0003 (OnCompanyOpen succeeded). This event has always included a custom dimension called entitlementSetIds that gives you the ID of the license entitlement for the user. You can use this to lookup the kind of licence that the user has, but translating the IDs into real license names could be tricky.
The translations for the entitlementSetIds values can be found here:
and you can embed the translations of the IDs into a KQL query around this event to know what type of users are accessing your system in a given period. Here is a KQL query showing all the users logged in the last day, with their user type and license:
traces
| where timestamp > ago(1d) // adjust as needed
| where customDimensions.eventId == "RT0003"
| project aadTenantId = customDimensions.aadTenantId
, eventId = customDimensions.eventId
, environmentName = customDimensions.environmentName
, environmentType = customDimensions.environmentType
, guestUser = customDimensions.guestUser
, userType = customDimensions.userType
, entitlementSetIds = customDimensions.entitlementSetIds
, usertelemetryId = case(

  toint( substring(customDimensions.componentVersion,0,2)) >= 20, user_Id
, 'N/A'
)
, userLicenseType = case(
    customDimensions.entitlementSetIds has 'd397d6c6-9664-4502-b71c-66f39c400ca4', 'DYN365_BUSCENTRAL_ENVIRONMENT'
  , customDimensions.entitlementSetIds has '920656a2-7dd8-4c83-97b6-a356414dbd36', 'DYN365_FINANCIALS_BUSINESS'
  , customDimensions.entitlementSetIds has '170991d7-b98e-41c5-83d4-db2052e1795f', 'DYN365_FINANCIALS_ACCOUNTANT'
  , customDimensions.entitlementSetIds has '3f2afeed-6fb5-4bf9-998f-f2912133aead', 'PROJECT_MADEIRA_PREVIEW_IW'
  , customDimensions.entitlementSetIds has '8e9002c0-a1d8-4465-b952-817d2948e6e2', 'DYN365_BUSCENTRAL_PREMIUM'
  , customDimensions.entitlementSetIds has 'd9a6391b-8970-4976-bd94-5f205007c8d8', 'DYN365_FINANCIALS_TEAM_MEMBERS'
  , customDimensions.entitlementSetIds has 'API.ReadWrite.All', 'API'
  , 'UNKNOWN'
)
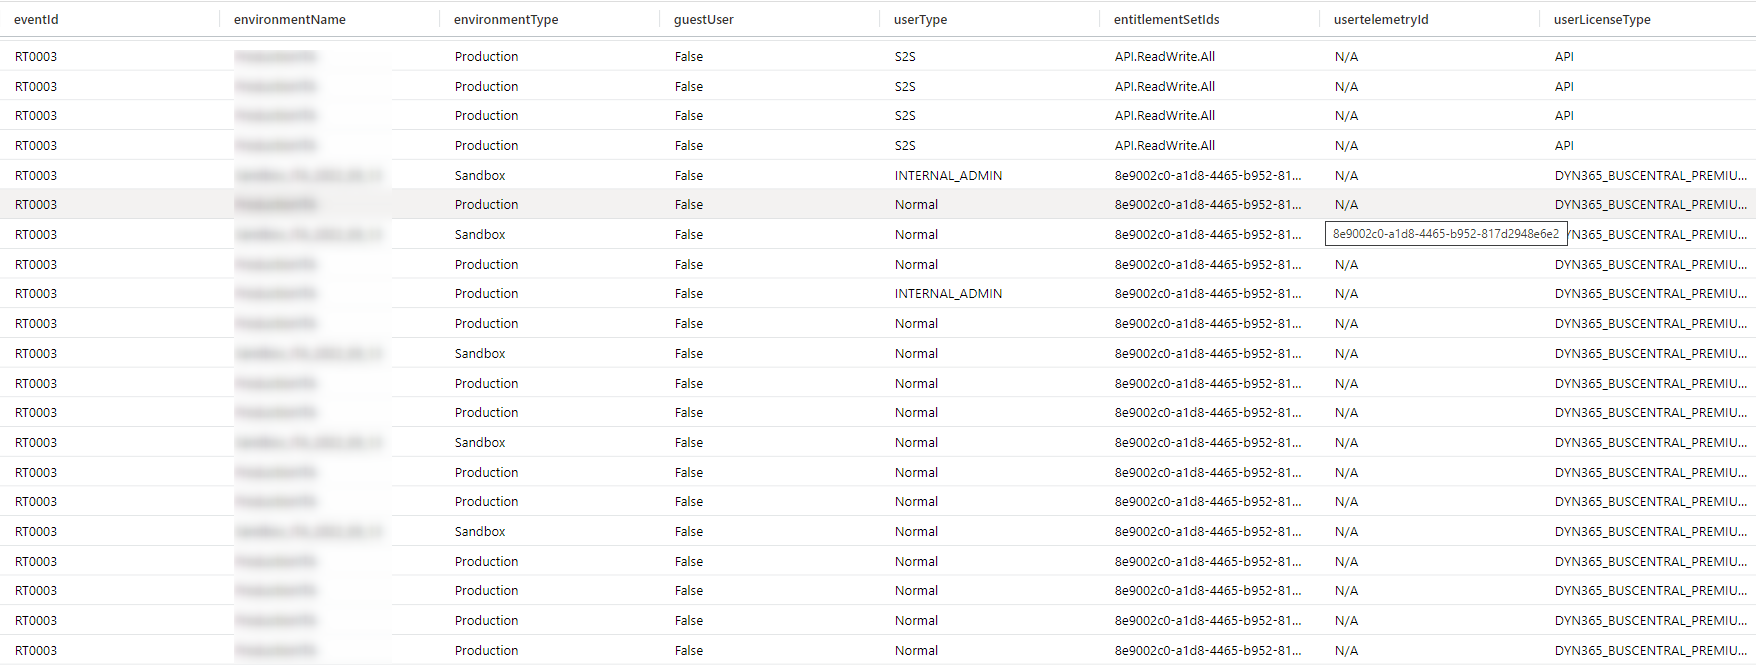
As you can see from the above image, I have some users with a PREMIUM license assigned and some users that are API users.
You can also create a chart (that can be added to a dashboard) for monitoring the license types accessing your Business Central environment in a given period. Here is a KQL query that shows a pie chart for every license type accessing the system in the last day:
traces
| where timestamp > ago(1d) // adjust as needed
| where customDimensions.eventId == "RT0003"
| project aadTenantId = customDimensions.aadTenantId
, userLicenseType = case(
    customDimensions.entitlementSetIds has 'd397d6c6-9664-4502-b71c-66f39c400ca4', 'DYN365_BUSCENTRAL_ENVIRONMENT'
  , customDimensions.entitlementSetIds has '920656a2-7dd8-4c83-97b6-a356414dbd36', 'DYN365_FINANCIALS_BUSINESS'
  , customDimensions.entitlementSetIds has '170991d7-b98e-41c5-83d4-db2052e1795f', 'DYN365_FINANCIALS_ACCOUNTANT'
  , customDimensions.entitlementSetIds has '3f2afeed-6fb5-4bf9-998f-f2912133aead', 'PROJECT_MADEIRA_PREVIEW_IW'
  , customDimensions.entitlementSetIds has '8e9002c0-a1d8-4465-b952-817d2948e6e2', 'DYN365_BUSCENTRAL_PREMIUM'
  , customDimensions.entitlementSetIds has 'd9a6391b-8970-4976-bd94-5f205007c8d8', 'DYN365_FINANCIALS_TEAM_MEMBERS'
  , customDimensions.entitlementSetIds has 'API.ReadWrite.All', 'API'
  , 'UNKNOWN'
)
| summarize NumLicenseType = count() by userLicenseType
| render piechart

You can also inspect, for a given license type, how these licenses access Dynamics 365 Business Central during the daily hours with the following query (here I’m excluding the API users and I’m summarizind data by hour of day):
traces
| where timestamp > ago(7d) // adjust as needed
| where customDimensions.eventId == "RT0003"
| project timestamp
, userLicenseType = case(
    customDimensions.entitlementSetIds has 'd397d6c6-9664-4502-b71c-66f39c400ca4', 'DYN365_BUSCENTRAL_ENVIRONMENT'
  , customDimensions.entitlementSetIds has '920656a2-7dd8-4c83-97b6-a356414dbd36', 'DYN365_FINANCIALS_BUSINESS'
  , customDimensions.entitlementSetIds has '170991d7-b98e-41c5-83d4-db2052e1795f', 'DYN365_FINANCIALS_ACCOUNTANT'
  , customDimensions.entitlementSetIds has '3f2afeed-6fb5-4bf9-998f-f2912133aead', 'PROJECT_MADEIRA_PREVIEW_IW'
  , customDimensions.entitlementSetIds has '8e9002c0-a1d8-4465-b952-817d2948e6e2', 'DYN365_BUSCENTRAL_PREMIUM'
  , customDimensions.entitlementSetIds has 'd9a6391b-8970-4976-bd94-5f205007c8d8', 'DYN365_FINANCIALS_TEAM_MEMBERS'
  , customDimensions.entitlementSetIds has 'API.ReadWrite.All', 'API'
  , 'UNKNOWN'
)
| where userLicenseType <> 'API'
| summarize count() by Hour=datetime_part("Hour", timestamp)
| render timechart
Result:

New interesting features that are on the plans for Dynamics 365 Business Central telemetry signals in the near future:
- AL stack trace will be added to job queue error signal.
- Error message in English will be added to error dialog signal.
- Ability for on-premises environments to set Environment Name as part of mounting.
- Error codes in failed OData calls to help troubleshoot 400 return code signal (this can help you on monitoring the exact reason on why external API calls fail).
- PTE validation signal (PTEs that block updates to next major): Microsoft compiles PTEs daily/weekly against next major. The results of this compilation will soon be emitted to telemetry and these data allow partners/customers to monitor/alert on PTEs that will block updates to next major. These new events will be available in environment telemetry from version 21.x (where X must be defined actually) and the new event IDs will be the following:
- LC0200: event reported when the validation of a PTE submission has started
- LC0201: event reported when a diagnostic is reported for a PTE submission itself. e.g. duplicate object Id
- LC0202: event reported when the validation of a PTE submission has completed successfully.
- LC0203: event reported when the validation of a PTE submission has completed with errors.
- LC0204: event reported when the validation of the main PTE has started.
- LC0205: event reported when the validation of the main PTE has completed successfully.
- LC0206: event reported when the validation of the main PTE has completed with errors.
- LC0207: event reported when the validation of a dependent PTE has started.
- LC0208: event reported when the validation of a dependent PTE has completed successfully.
- LC0209: event reported when the validation of a dependant PTE has completed with errors.
- LC0210: event reported when a diagnostic is reported during the validation of an extension in an AppSource submission.
I’ve also personally uploaded on the Microsoft’s telemetry repo some samples for advanced alterting with Application Insights if you need to create alerts on these new telemetry signals in the future.
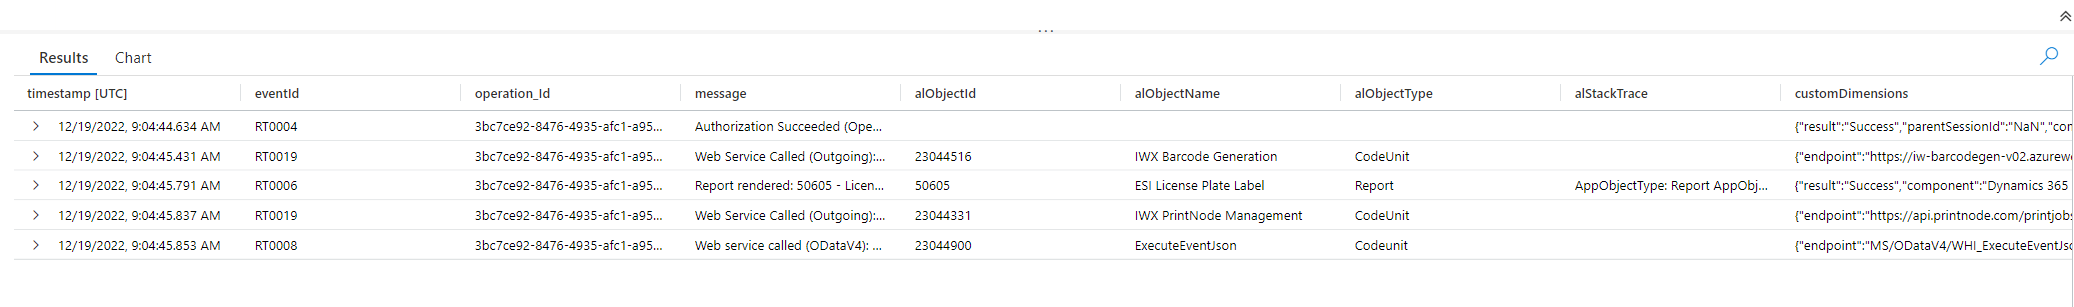
Finally, a tip that can be useful (we showed this in our latest Telemetry workshop in Microsoft Italy last month, so if you was there I think you already know it): if you want to check what happens in a particular session when you discover a problem, remember that Business Central telemetry events expose a field called operation_id mapped with the user’s Application Insights session id.
This is an example of a KQL query that helps you on checking what happens in a session in a particular time range of the day:
traces
| where timestamp >= datetime(2022-12-19 09:00:18.0587533) // adjust as needed
| where timestamp <= datetime(2022-12-19 18:29:18.0587533) // adjust as needed
| where operation_Id == '3bc7ce92-8476-4935-afc1-a95ea1b9c598'
| extend eventId = customDimensions.eventId
, alObjectId = customDimensions.alObjectId
, alObjectName = customDimensions.alObjectName
, alObjectType = customDimensions.alObjectType
, alMethod = customDimensions.alMethod
, alStackTrace = customDimensions.alStackTrace
| project timestamp, eventId, operation_Id, message, alObjectId, alObjectName, alObjectType, alMethod, alStackTrace, customDimensions
| order by timestamp asc
Result shows all the operations in the given session + details of the objects involved and the relative stack trace:
Have fun with telemetries… 🙂


Hi Stefano,
You mentioned:
“if you want to check what happens in a particular user session when you discover a problem, remember that Business Central telemetry events expose a field called operation_id mapped with the user’s Application Insights session id.”
Where can I find user’s Application Insights session id? I just familiar with user’s telemetry id on User card.
Thanks in advance?
LikeLike
Hi, it’s not exactly the user session. The operation_id is the Application Insights session id. This is useful to investigate what happened in a session prior to an event you see in telemetry. As an example: if you see an error in telemetry and you want to investigate the transaction that causes the event (chain of events), you can retrieve the operation_id and then filter the events that have this operation_id field.
LikeLike
Oh I see, thank you for your clarification
LikeLike