

When developing extensions for AppSource, every partner has its own licensing model. There are extensions that are free, others that are billed by users, others that have a fixed price for each month or year of usage and so on. Everyone can have its own way of billing their customers for using an extension. But there are also some extensions that are billed for the number of generated records on a period (electronic document transmissions for example often works on this way).
For this last requirement, an ISV has the needs to know how his customers around the globe are using the custom tables declared on his extension. How many record customer X have on my extension’s tables? Is there a way to read this data via the tenant’s telemetry?
I think that you know that starting from Dynamics 365 Business Central 2020 Wave 2, partners and ISVs can emit custom telemetry signals to Application Insights by using the Session.LogMessage command. All is explained here.
On a SaaS tenant Microsoft emits tons and tons of telemetry signals from the Base Application, but lots of these signals are not visible to everyone because Microsoft emits these signals with the TelemetryScope::ExtensionPublisher scope (and this means that the signal is visible only to the extension’s publisher, so Microsoft).
If you check the Base Application, you can see that there’s a codeunit called “Generate Activity Telemetry” that is used to send trace tags on Application Insights about the usage of a set of tables. This codeunit does something like the following:
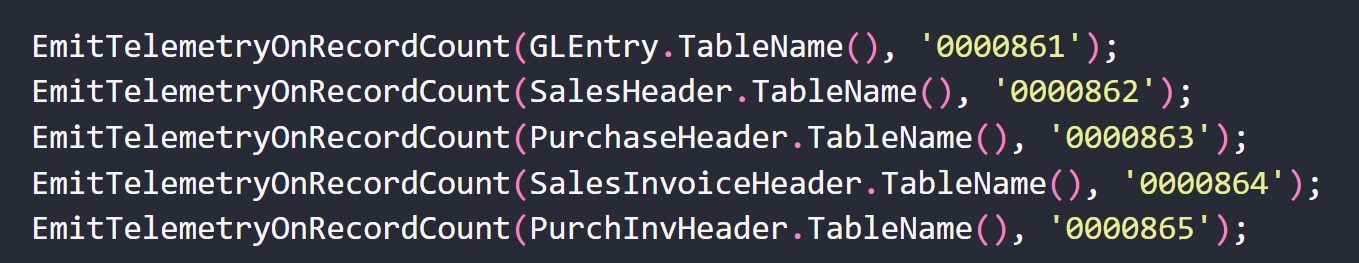
and the EmitTelemetryOnRecordCount procedure is defined as follows:
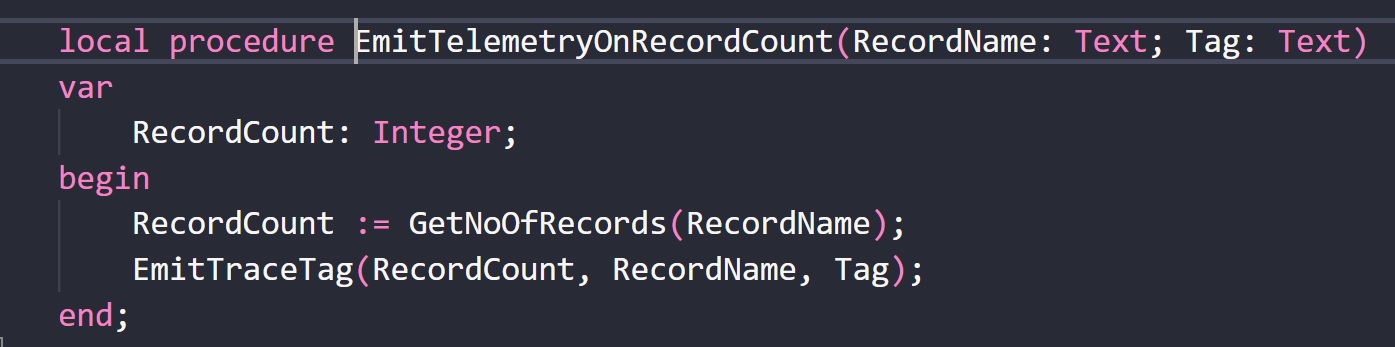
It counts the number of record for a table and then emits a trace tag to Application Insights (with the particular tag id) in the following way:
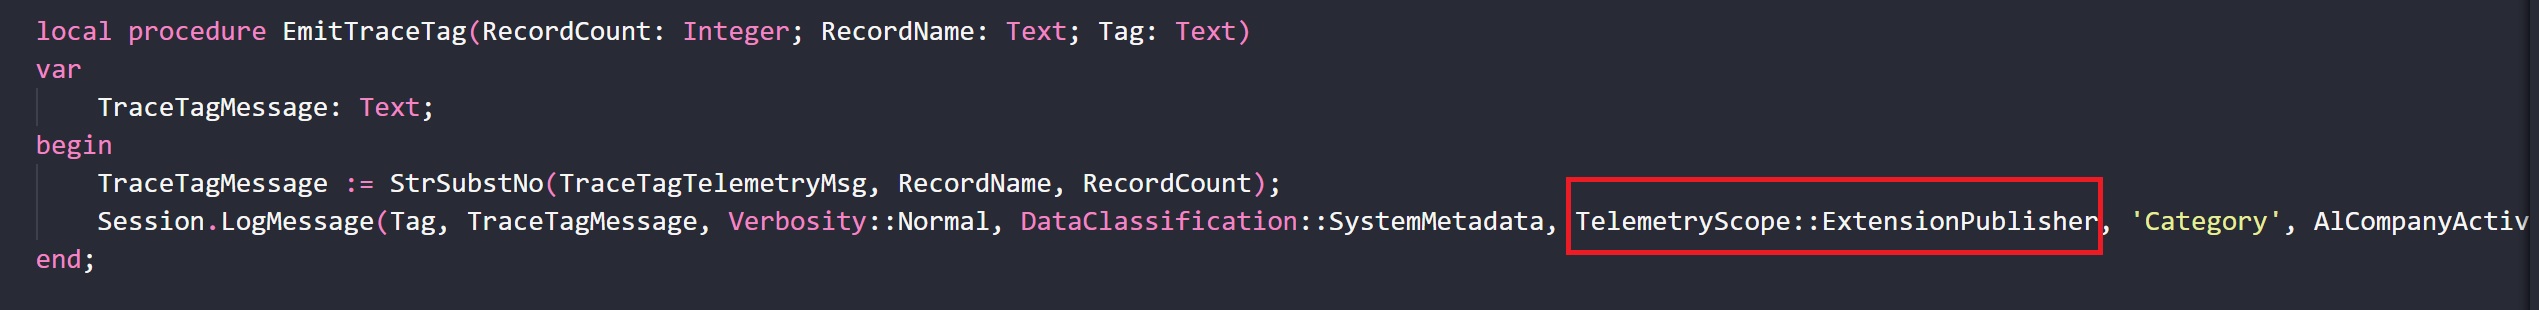
As you can see, the trace tag scope is ExtensionPublisher and that means that this data is only visible on Microsoft’s telemetry.
How you can do the same for monitoring your extension’s tables usage, without impacting on the tenant’s performances (not too much trace tags sent to your Application Insights)?
A possible solution for this is to subscribe to the OnActivityTelemetry event of the Generate Activity Telemetry codeunit and then inject here your custom signals, like in this example:
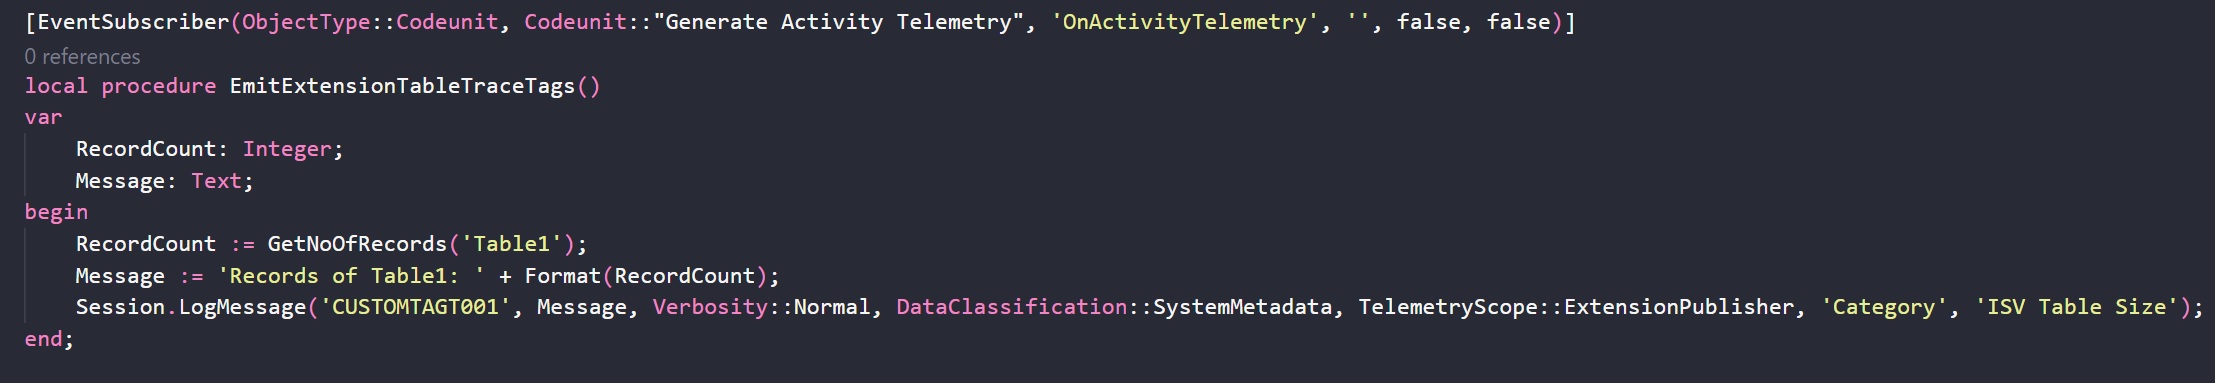
In this way you’re respecting the Microsoft’s telemetry pattern and you can monitor the usage of your extensions easily from your Application Insights instance (and you can also configure alerts for receiving notifications is a customer is over a predefined threshold).
