


Yesterday at our “Dynamics 365 Business Central Wave 2 What’s new” event in Microsoft Italy we quickly saw hot to debug the Microsoft’s Base Application from Visual Studio Code. I’ve not spent too much time on this topic due to lack of time, but here is a summary of what I’ve done yesterday (answer to a question received after the event).
As a first step, you need the Microsoft Base Application source files, available from the Dynamics 365 Business Central on-premise DVD (as a .zip file) or that you can extract from a Docker container in the following way:
$alProjectFolder = "C:\SD\BaseApp"

Create-AlProjectFolderFromBcContainer -containerName $containerName `
-alProjectFolder $alProjectFolder `
-useBaseLine -useBaseAppProperties -addGIT
This command creates a fresh new Visual Studio Code project with all the Microsoft Base app source code. In this way, you can open an standard object and place a breakpoint on the object (piece of code) where you need to start debugging (a trigger, a function, a line of code etc.).
In Visual Studio Code, AL now has a feature called “Attach and debug next“. Open your launch.json file and click on Add Configuration. Here you have the following choices:

You can attach your debugging session to a cloud sandbox or a local client. We’re working on-premise, so select the Attach to the next client on your server option.
Now in your launch.json fiel you have two configuration sections, one with “request”:”launch” (the session where the app is published) and one with “request”:”attach” (the session where the debugging session is attached):

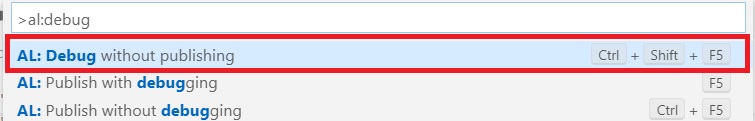
Now you’re ready to debug. Select AL:Debug without publishing (CTRL+SHIFT+F5):
then execute a desired action on your Dynamics 365 Business Central environment. Voilà, the debugging session starts and code stops at your breakpoint.
Happy debugging!
