

The last weeks of the year are quite always extremely busy days due to go -lives.
The go-live of an ERP solution is always a critical moment for a company’s future software infrastructure, and every aspect requires the best attention (functionality to be activated, data recovery, code to deploy, solution performance, monitoring). Very often, an ERP upgrade involves the transition from a very old software solution to a new one, and the expectations are a lot.
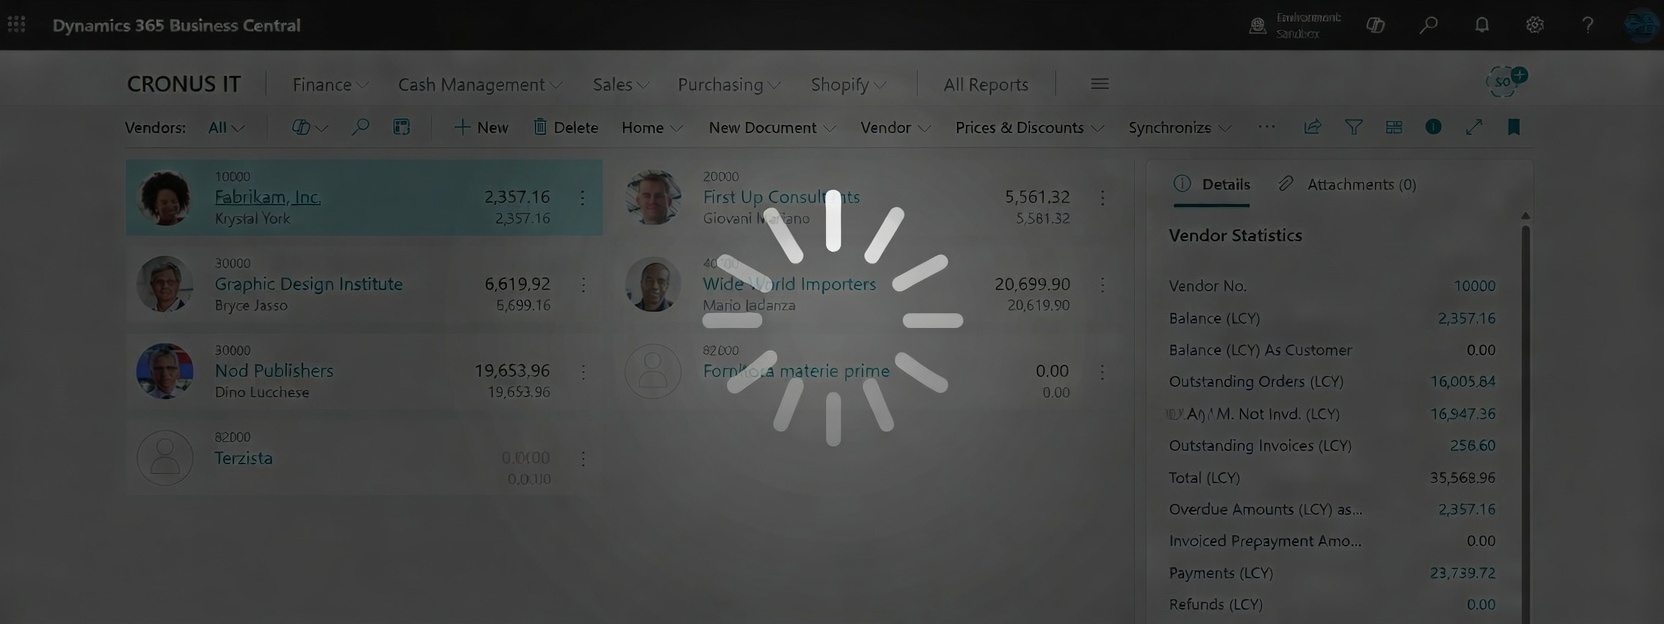
Today I’d like to talk about a perhaps secondary aspect that I often see emerge when going live with a browser-based ERP like Business Central: have you ever received questions like “the pages are quite slow to open“, or “it’s slow to open on my PC, but not on my boss’s one“, or “well, but the old character-based ERP was much faster“…
A modern ERP like Dynamics 365 Business Central uses the browser as a front-end (UI) and you need to consider also this aspect if you want to be fully ready for the future. The browser has performance impact, and you need to be aware of that.
You can have optimized everything in the code and in the backend side (locks, indexing, concurrency etc.) but the UI could feel slow for the end user despite all your backend optimizations.
When a user interacts with the Business Central UI, some steps are involved:
- Request is sent over the network to the Business Central server (and often this requires more than a single step due to the distributed nature of a SaaS application)
- AL code is executed server-side
- A result is sent over the network to the client (browser)
- The result is processed (client side)
- The result is rendered in the UI (via the browser)
All these steps take time!
How much time? It depends on many aspects (that are often the cause of the feeling of slowness of the UI). Here I want to talk exactly about those aspects, because I see that often are not considered in an full infrastructure assessment for a Business Central project. Let’s follow the above flow…
Network latency
Dynamics 365 Business Central is a SaaS application and it runs on Microsoft datacenters, physically located in different Azure Regions that are not often closed to your customers. When a request is sent over the network (from client to NST or vice-versa) you need to consider the network latency.
Business Central is designed for networks that have a latency of 250–300 milliseconds (ms) or less. This latency is the latency from a browser client to the Microsoft Azure datacenter that hosts the app. This is probably the first thing to monitor and it can have a big impact on the UI performance.
To give an example, here is the network latency that I have now reaching different Azure regions:
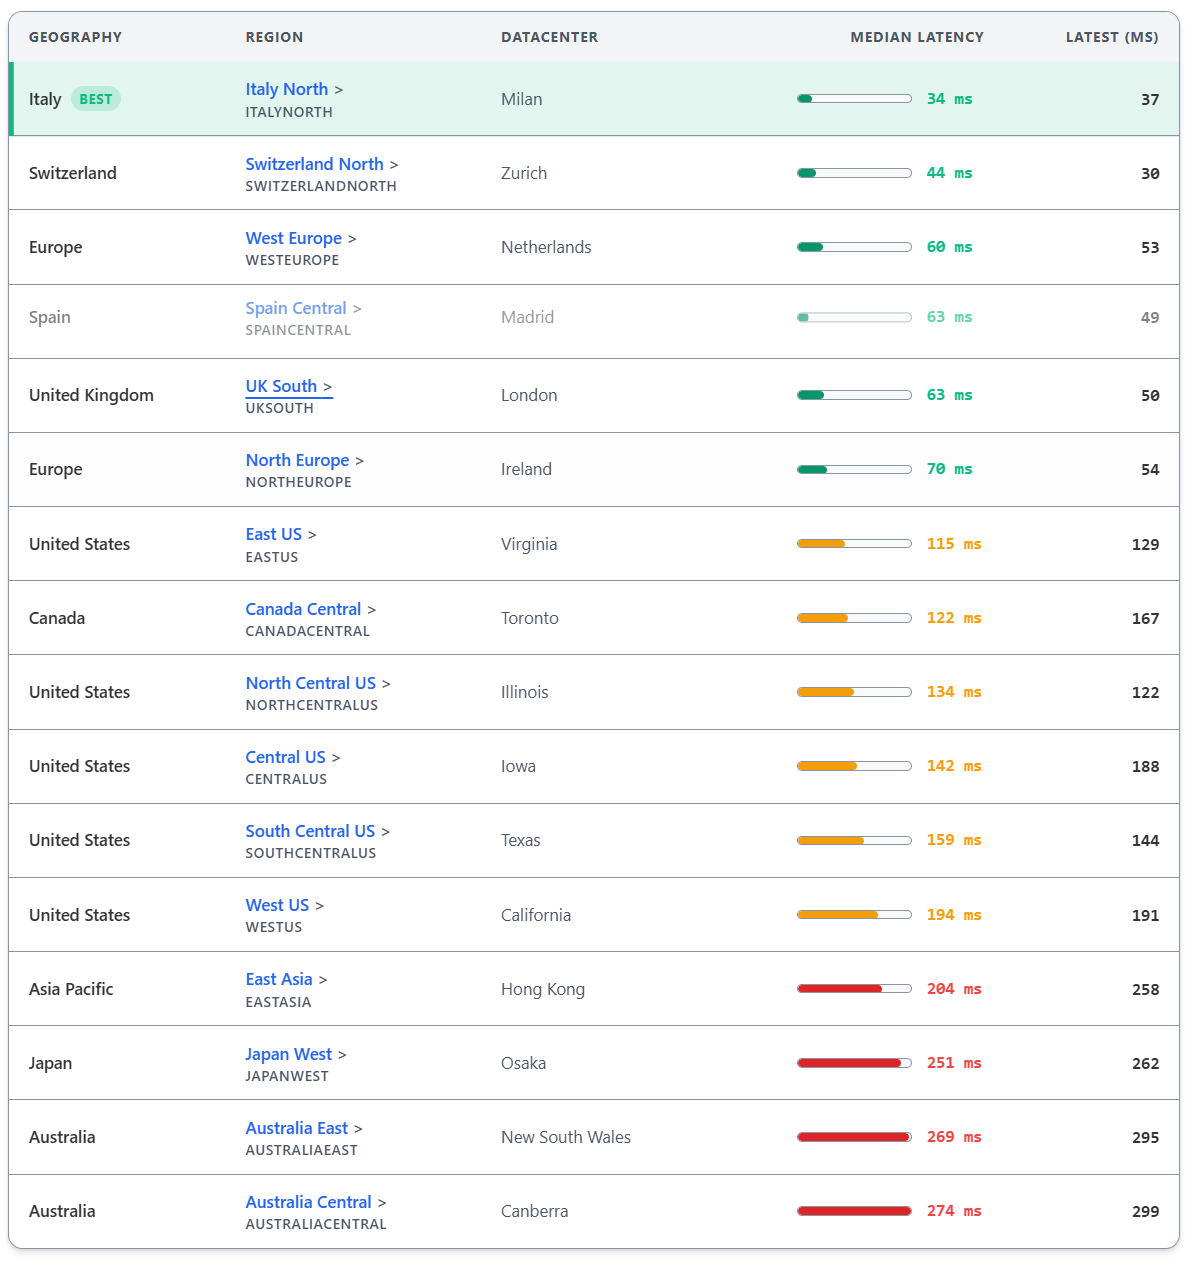
As you can see from the above image, I have the best latency when reaching customers located in Italy North or Switzerland North datacenters. But at the moment quite every Italian Business Central customer is located on West Europe or North Europe datacenters and as you can see the latency is about double compared to Italy North.
Other common scenario that I see quite often is customers from a country reaching Business Central located on a different country. For example, imagine an IT customer that is using a company of a US-based Business Central instance (because the main headquarter is a US-based company). As you can see, in this case the latency is much bigger.
Microsoft always hosts Business Central environments closer to where your customers are located, all static resources are stored on CDN to make sure closest distance to the user, Microsoft also maintain one WebSocket connection between browser and backend to minimize time spent on multiple new connections (also using native Web Socket compression) but network latency is for sure an aspect that you need to assess.
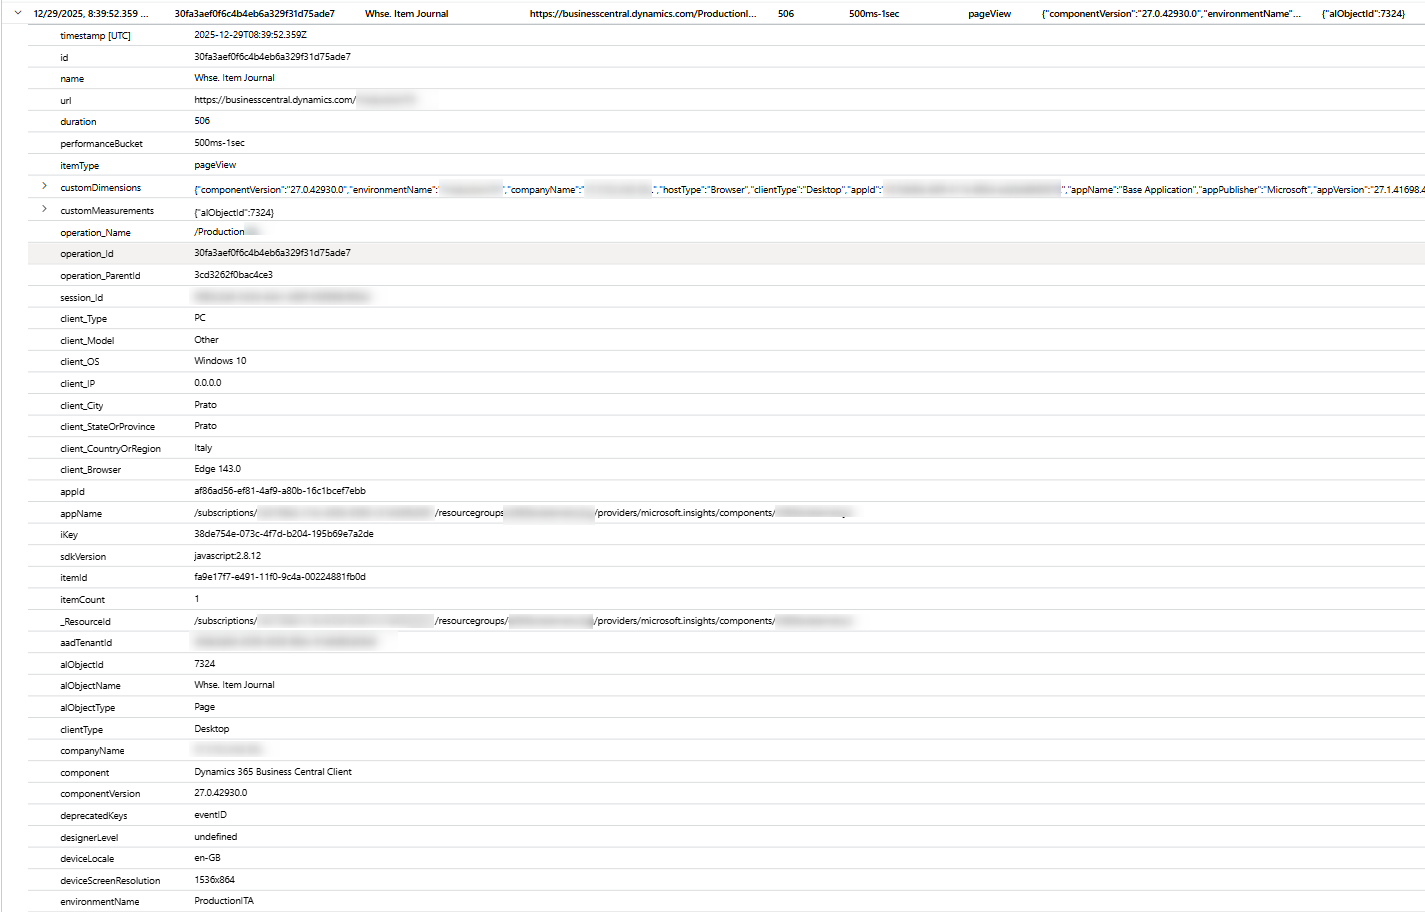
To help on monitoring those aspects, the Page View telemetry also gives you important metrics:
There are also announced plans from Microsoft to add to the Page opened telemetry signal two new interesting parameters that can help on monitoring latency (no ETA for that):
- downloadlink: effective bandwidth estimate of the user (mebabits per second)
- rtt: effective round-trip time of the user’s currect connection
Browser’s impact
This is probably obvious but Business Central is designed to work with a modern browser and this means the current versions of Microsoft Edge, Google Chrome, Apple’s Safari and Firefox (despite I don’t recommend it). Some Business Central performance features and optimizations (for example as page caching) are only available for those modern browsers. Don’t use any other browsers than the stable versions of the first three, this is what I personally recommend.
Remember also that any browser policies or security settings that restrict access to local storage or the browser’s IndexedDB database may prevent Business Central from applying performance optimizations. Browser’s storage is also used to persist things in the UI, like for example the resize of the columns in a page.
Another important performance aspect to keep in mind when using Business Central in the browser is the use (and abuse!) of Tabs. Since each browser tab is considered a “sandbox”, browsers need to load all resources again (mostly from cache) for each tab you open (and usually opening Business Central in a new tab takes around10 seconds). This also consumes memory in the local system.
Generally speaking, having lots of opened tabs does not help performance and you should always evaluate a tradeoff between multi-tasking and speed.
The browser responsiveness is also impacted by how the AL page is designed (heavy client add-ins in factboxes or in the page, complex pages with a big number of AL controls etc) but that’s another story that I don’t want to cover here.
Local machine
What about the impact of the local machine configuration?
No one ever considers this aspect and often in a large organization the end user PCs are stretched to the limit in terms of hardware resources.
Who would ever lose the speed race between a Ferrari, a Lamborghini and a Panda? 😉

The local machine is your point of access to the Business Central UI! The UI is rendered via the browser but the local machine configuration has a big impact on how this rendering is performed. More in details:
- CPU: handles JavaScript execution, DOM manipulations, initial rendering calculations. More cores + higher clock speed = faster script execution and layout recalculation.
- RAM: Larger allocations prevent browser memory pressure, tab thrashing. Business Central with multiple tabs/extensions benefits enormously from 16GB+.
- GPU: Accelerates composite operations, CSS transforms, animations. Browser-side data grid scrolling, chart rendering, animated dialogs all use GPU.
- Storage: SSD vs HDD affects browser cache performance.
Related to the local machine configuration, Microsoft is also planning to add to the Page opened telemetry signal also the following two metrics (no ETA at the moment):
- deviceMemory: the approximate amount of device memory (RAM) in gigabytes.
- cpuCores: the number of logical processors available to run threads on the user’s computer.
Don’t under-estimate the hardware resources (alias your pc configuration) if you want to be fast!
To measure the capability of your local machine you can use some public tests like Speedometer 3.1. This is a comprehensive browser performance benchmark that tests JavaScript execution, DOM manipulation, rendering, and UI layouts displaying. It simulates real-world interactions like form input, list rendering, and dynamic updates. The results are standardized and repeatable, making it good for comparing different machines.
Remember that Speedometer 3.1 is generic web app performance. Business Central’s UI has specific characteristics that a general benchmark won’t capture, so it should be used as a baseline, not as a generic benchmark.
If you start doing some tests on different hardwares combining Speedometer 3.1 tests and custom Business Central UI rendering tests (on browsers) you will probably discover interesting things (higher is better):
- A Surface Laptop 6 reaches a value of 29.7
- iPhone Pro Max 17 reaches 32.5
- Surface Book 3 reaches 21.8
- Lenovo Thinkpad T460 reaches 18.6
- MacBook Pro M4 Max reaches 48.9
As you can see, I’ve placed here also the test with an iPhone…
Speedometer measures browser JavaScript execution, DOM manipulation, and rendering in synthetic conditions. The iPhone 17 Pro’s Safari browser on Apple Silicon is highly optimized for these specific operations. The benchmark runs in a controlled environment without the thermal constraints or background processes that affect real machines. The A19 Pro doesn’t throttle during a benchmark run, and iOS’s focused resource management means consistent performance.
But Business Central requires:
- Large screen real estate for complex forms and grids
- Keyboard/mouse input at speed
- Multiple simultaneous browser tabs
- Developer tools/debugging
so the test using the iPhone is not a valuable benchmark in this case. This is exactly the reason why previously I said that these benchmarks must be executed on your real used hardware and with your working conditions and applications.
Generally speaking, in my experience the hardware counts a lot also on Business Central UI responsiveness and the latest Apple Silicon devices (M2 processor or above) are the best on every test in this aspect. No Surface or Thinkpad devices are at the moment comparable (simply Apple does it better, like Italians 😉).
To help measuring the browser’s rendering capabilities, here is a Node.js script that you can quickly use. The script uses Puppeteer, a Node.js library that provides a high-level API to control Chrome or Chromium browsers programmatically.
This code launches a new browser instance using Puppeteer with specific configuration:
browser = await puppeteer.launch({
    headless: true,
    args: ['--no-sandbox', '--disable-setuid-sandbox']
});
More in details:
- puppeteer.launch(): reates and starts a new Chromium browser instance
await: Waits for the browser to fully launch before continuing- headless: true: Runs the browser without a visible window (in the background). This is faster and uses less resources. Set to
falseif you want to see the browser window. - args: Array of command-line arguments passed to the Chromium browser:
--no-sandbox– Disables the Chrome sandbox security feature. Often needed when running in Docker containers or CI/CD environments--disable-setuid-sandbox– Disables the setuid sandbox (another security feature). Also commonly needed in containerized or restricted environments
These sandbox flags are typically used to avoid permission issues, especially on Linux servers or Docker containers where the sandbox may not work properly. The script accept a page url as input and returns how long it takes to fully load in the browser:
node bc-page-perf-cli.js "https://businesscentral.dynamics.com/tenantid/Sandbox?company=CRONUS%20IT&page=31"
Conclusion
Network latency and how the page is designed (code-behind, number of controls displayed, control add-ins etc) are probably the two aspects with the biggest impact on how a page renders in the UI and how slow of fast it appears to the end user. But they’re not alone: also the browser and the user machine can have a considerable impact on this.
The Speedometer test and the script I provided are some useful tools to check on how a Business Central page responds and to monitor how a client is able to respond to the UI needs (rendering controls etc). It’s very hard to prescribe minimum device or network requirements and recommendation is to measure and monitor systems under load to establish a baseline and then to detect regressions.
Don’t under-estimate the impact of the client. Having a good machine, with RAM and dedicated GPU helps a lot.
