


Few days ago Microsoft announced the public preview of a very interesting feature: Microsoft Graph Activity Logs in Azure Monitor.
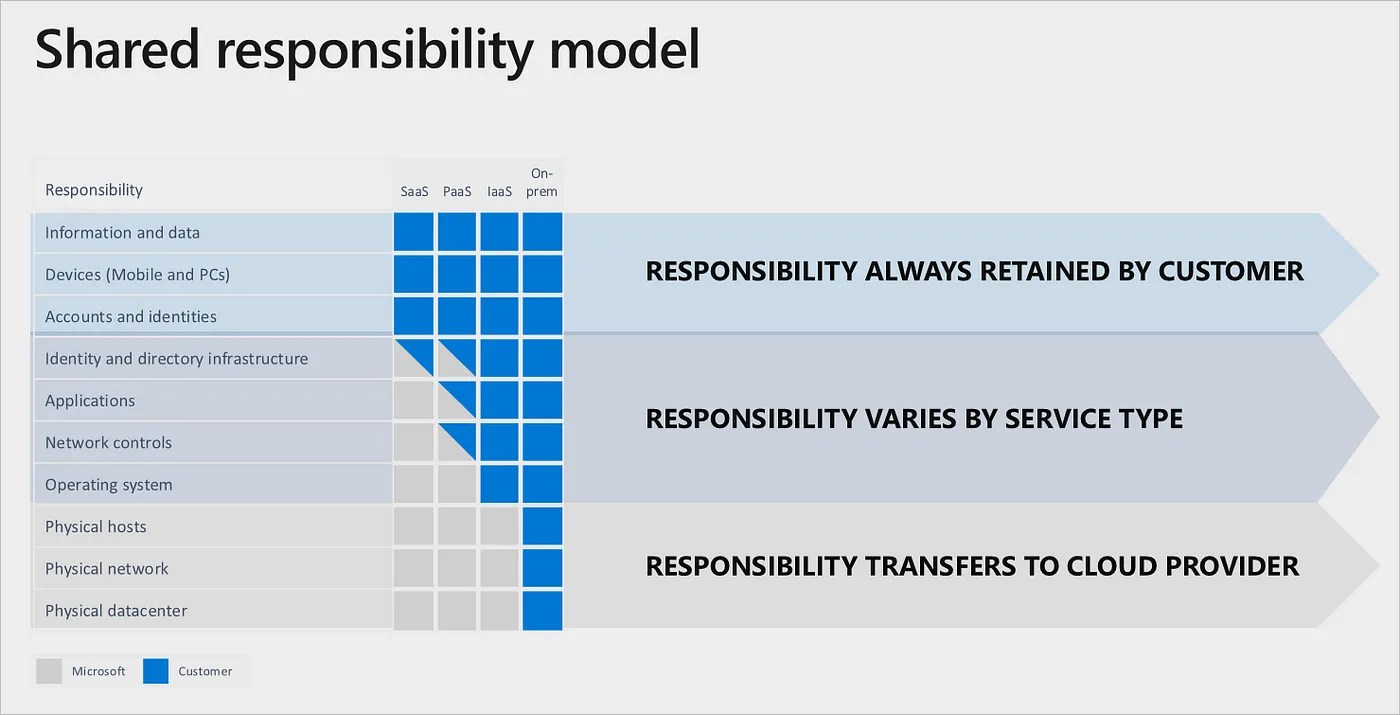
You already know that for me (but I hope for everyone of you) monitoring a SaaS environment is a must for better governance and for proactively react to possibile problems. In this blog I talked a lot in the past about different types of monitoring activities that you should have in place for managing your SaaS customers at best. When talking about this topic, I always redirect customers and partners to the “shared responsibility model” of a cloud service:
In my opinion, you should use Azure Monitor for:
- Monitoring the Dynamics 365 Business Central tenant.
- Monitoring the different types of cloud services that interact with your tenant (Azure Functions, Azure Logic Apps workflows, web apps and more).
- Monitoring Power Automate (preview, more on this at our telemetry section at Directions EMEA in Lyon).
- Monitoring Dataverse.
- Monitoring activities related to Microsoft Entra and Microsoft Graph.
This last point is something often forgotten. The export of Activity logs should always be configured for each Azure subscription individually.
Have you wondered what applications are doing with the access you’ve granted them? Have you discovered a compromised user and hoped to find out what operations they have performed? If so, you can now gain full visibility into all HTTP requests accessing your tenant’s resources through the Microsoft Graph API.
You’re currently able to collect SignIn logs to analyze authentication activity and Audit logs to see changes to important resources. With Microsoft Graph Activity Logs, you can now investigate the complete picture of activity in your tenant, from a token request in SignIn logs, to API request activity (reads, writes, and deletes) in Microsoft Graph Activity Logs, to ultimate resource changes in Audit logs.
The Microsoft Graph Activity Logs include information about the request and client application. Some common use cases include:
- Identifying the activities that a compromised user account conducted in your tenant.
- Building detections and behavioral analysis to identify suspicious or anomalous use of Microsoft Graph APIs – such as an application enumerating all users; or making probing requests with many 403 errors.
- Investigating unexpected or unnecessarily privileged assignments of application permissions.
- Identifying problematic or unexpected behaviors for client applications – such as extreme call volumes that exhaust rate-limits for the tenant.
How to integrate Microsoft Entra logs with Azure Monitor
To start using Microsoft Entra logs with Azure Monitor, you need to have a Microsoft Entra ID P1 or P2 tenant and you need to create an Log Analytics workspace in your Azure subscription.
When you have those requirements, sign in to Microsoft Entra Admin Center (https://entra.microsoft.com/) as Global Administrator or Security Administrator for the tenant, then browse to Identity > Monitoring & health > Diagnostic settings and select Add diagnostic setting:

In the Diagnostic setting page, give a name for the new setting and select the log categories that you want to stream. Important here is to select the new MicrosoftGraphActivityLogs category:

Under Destination Details select the Send to Log Analytics workspace check box, then select the appropriate Subscription and Log Analytics workspace from the menu and click on Save.
After a bit of minutes (about 15minutes in my experience) logs will appear in your selected Log Analytics workspace and now you can start analzying them.
Start analyzing your logs
Some example of KQL queries that you can execute and use for monitoring your tenant:
Top 20 app instances by request count in the last 7 days:
MicrosoftGraphActivityLogs
| where TimeGenerated > ago(7d)
| summarize RequestCount=count() by AppId, IpAddress, UserAgent
| sort by RequestCount
| limit 20
Discover requests that failed due to authorization in the last day:
MicrosoftGraphActivityLogs
| where TimeGenerated > ago(1h)
| where ResponseStatusCode == 401 or ResponseStatusCode == 403
| project AppId, UserId, ServicePrincipalId, ResponseStatusCode, RequestUri, RequestMethod
| limit 100
List of apps that are assigning an app role to a security group:
MicrosoftGraphActivityLogs
| where TimeGenerated > ago(1d)
| where RequestUri contains '/appRoleAssignments'
| where RequestMethod != "GET"
| summarize UriCount=dcount(RequestUri) by AppId, ResponseStatusCode
List of apps accessing OneDrive:
MicrosoftGraphActivityLogs
| where TimeGenerated > ago(1d)
| where RequestUri contains '/drive'
| where RequestMethod != "GET"
| summarize UriCount=dcount(RequestUri) by AppId, ResponseStatusCode
By applying also this activity logs export to a Log Analytics workspace, you can consolidate telemetries and you can create an always more powerful monitoring experience (imagine a dashboard consolidating data from your tenant’s Azure serverless applications, Business Central, Power Platform apps, Microsoft Entra activites etc. in a single place).
Please note that at the time of writing this post not all Azure subscriptions will have this feature enabled and ready. Rollout is in progress, so be patient…
