Azure Application Insights is the Azure Monitor extension (service) for monitoring the performance of live cloud applications, collecting real-time telemetries and detecting anomalies. I think that everyone of you know that because this service is a foundamental part of a well-architected cloud solution and also for a well-architected Dynamics 365 Business Central ERP solution.
But when talking about a Dynamics 365 Business Central ERP solutions, you know that quite often an ERP architecture involves lots of other different services to extend and complement the ERP. The external services that I personally see often used in a Dynamics 365 Business Central ERP solution are mainly:
- Azure services (Azure Storage, Azure Functions, Azure Logic Apps, Azure web apps, Azure API Management, Azure SQL databases etc).
- Power Platform services (Power Automate, Power Apps, Power BI)
When talking about best-practices for monitoring a full cloud solution, in this blog I’ve always pushed the recommendation to use Azure Application Insights to redirect the telemetries of ALL the actors of your solution. In this way you can have centralized monitoring and you can create analysis and dashboards that includes all the actors of a solution working together.
Saying that, starting from yesterday there’s an important news for every Power Automate creators: the public preview of the integration of Power Automate flow telemetry data with Azure Application Insights. With this new capability, administrators and PA customers can connect their Microsoft Power Platform environment to an Azure Application Insights instance for advanced diagnostic and monitoring of their automations. This includes metrics dashboards, out-of-the box and custom alerts, performance diagnostics and custom analysis of cloud flow telemetry via log analytics. You can connect multiple environments into a single instance of Application Insights.
How to setup telemetry export to Application Insights
To setup the Power Automate telemetry export to Azure Application Insights, from the Power Platform Admin Center (https://admin.powerplatform.microsoft.com) select the Analytics|Data Export menu and then New Data Export:
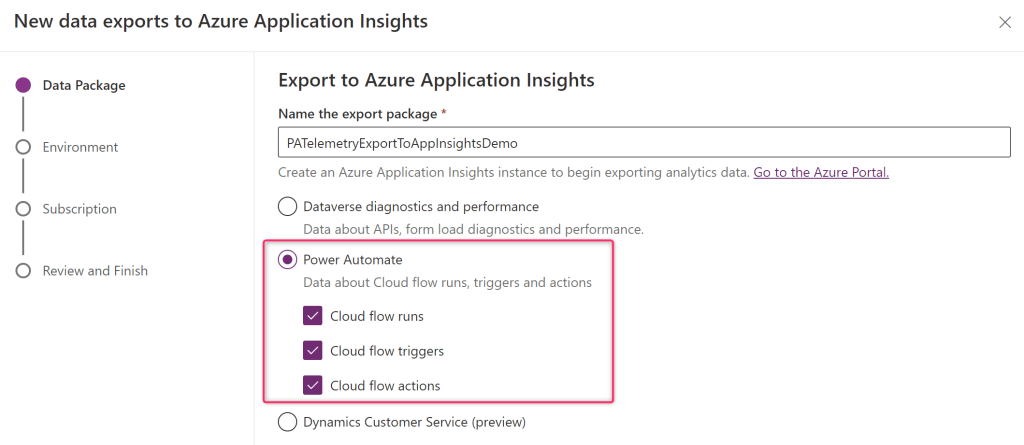
In the New data exports to Azure Application Insights window, select the name of the export package (I suggest to include the name of the Azure Application Insights instance on it), then select Power Automate and select whether to export cloud flow runs, triggers, and/or actions:
Click on Next and then select the environment that you’re exporting data from. Only Managed environments can be selected. For this Public Preview only, the Managed Environment restriction is relaxed:
Click on Next and then select the Azure Application Insights connection details (you need to select the Azure subscription, resource group, and Application Insights environment that you’re exporting data to). Then select Next:
You must have contributor, writer, or admin rights to the Application Insights environment.
Then review the details that you entered for the new export package and select Create to set up the data export connection. The data export connection will be set up and within the next 24 hours, data will start being exported to your Application Insights environment.
Power Automate telemetry flows into two tables on Application Insights:
- Requests: Contains cloud flow runs data.
- Dependencies: Contains cloud flow triggers and cloud flow actions data.
You can then perform monitoring, alerting, custom debugging etc. from Application Insights.
Monitoring Power Automate flow executions
Cloud flow execution can be monitored by selecting Metrics from the left navigation menu and then select Server requests:
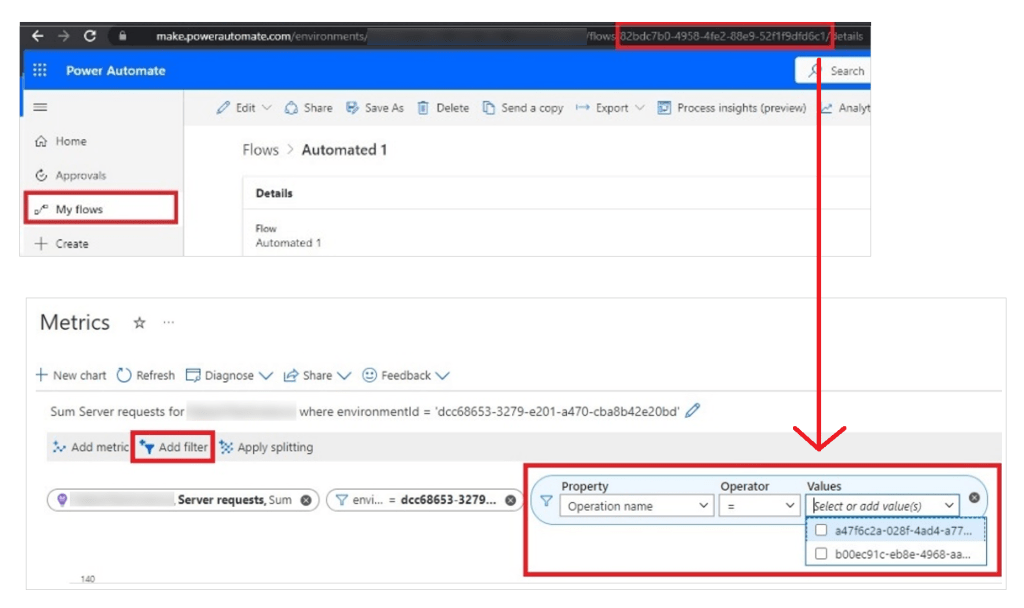
For filtering cloud flow executions to a specific environment, select Add filter and then select environmentId from the Property field and select your environment.
For filtering cloud flow executions to a specific Power Automate flow or a set of flows, select Add filter, and then select Operation name from the property field and select the flow(s) you want to monitor. The Operation Name field maps to the flow identifier (Guid) you see from Power Automate:
Monitoring Power Automate flows triggers and actions executions
Cloud flows triggers and actions can be monitored by select Metrics from the left navigation and select Dependency calls from the Metric filter. Then,
- Filter for environment ID to filter for a specific environment.
- Select Add filter > Signal Category from the Property filter.
- Select Cloud flow triggers or Cloud flow actions to filter for triggers and actions respectively:
Here you can also add a filter for ResourceId to select triggers and actions for a specific flow Id. (Guid of the flow in Power Automate). You can also add a filter and select Operation Name from the property filter to specify the names of specific actions or triggers if you want to analyze. These filters are the same as the display names of triggers and actions of the cloud flow you would see in the Power Automate designer.
Monitoring Power Automate flows with KQL
You can also directly use KQL queries. For example, here is a query showing failures for a Power Automate specific flow in the last 7 days:
let myEnvironmentId = 'Insert your environment ID here';
let myFlowId = 'Insert your flow ID here';
requests
| where timestamp > ago(7d)
| where customDimensions ['resourceProvider'] == 'Cloud Flow'
| where customDimensions ['signalCategory'] == 'Cloud flow runs'
| where customDimensions ['environmentId'] == myEnvironmentId
| where customDimensions ['resourceId'] == myFlowId
| where success == false
Here is a KQL query showing Power Automate workflows trioggers or actions failures in the last 7 days:
let myEnvironmentId = 'Insert your environment ID here';
let myFlowId = 'Insert your flow ID here';
dependencies
| where timestamp > ago(7d)
| where customDimensions['resourceProvider'] == 'Cloud Flow'
| where customDimensions['signalCategory'] == 'Cloud flow triggers'
| where customDimensions['environmentId'] == myEnvironmentId
| where name == myTriggerOrActionName
| where success == false
As said before, remember that this feature will be available for Managed Environments only. To use this feature, users will need a Power Apps, Power Automate, or Dynamics 365 license with premium use rights. For this Public Preview only, the premium use rights requirement and the Managed Environment restriction are relaxed.
I think that also if you’re a Power Automate user, now you don’t have to forget that Azure Application Insights can be a crucial part of your solution. If you’re using (and not abusing 😜) Power Automate with Dynamics 365 Business Central solutions, this should be a best practice to start adopting.


